Eino Dev Visual Debugging Plugin Guide
Overview
💡 Use this plugin to visually debug orchestration artifacts built with Eino (Graph, Chain):
- Visual rendering of orchestration
- Start from any operable node and debug with mock input
Quick Start
Download eino-examples
Repo: https://github.com/cloudwego/eino-examples
git clone https://github.com/cloudwego/eino-examples.git
# or
git clone git@github.com:cloudwego/eino-examples.git
Install Dependencies
In the project directory, run the following in order:
go get github.com/cloudwego/eino-ext/devops@latest
go mod tidy
Run the Demo
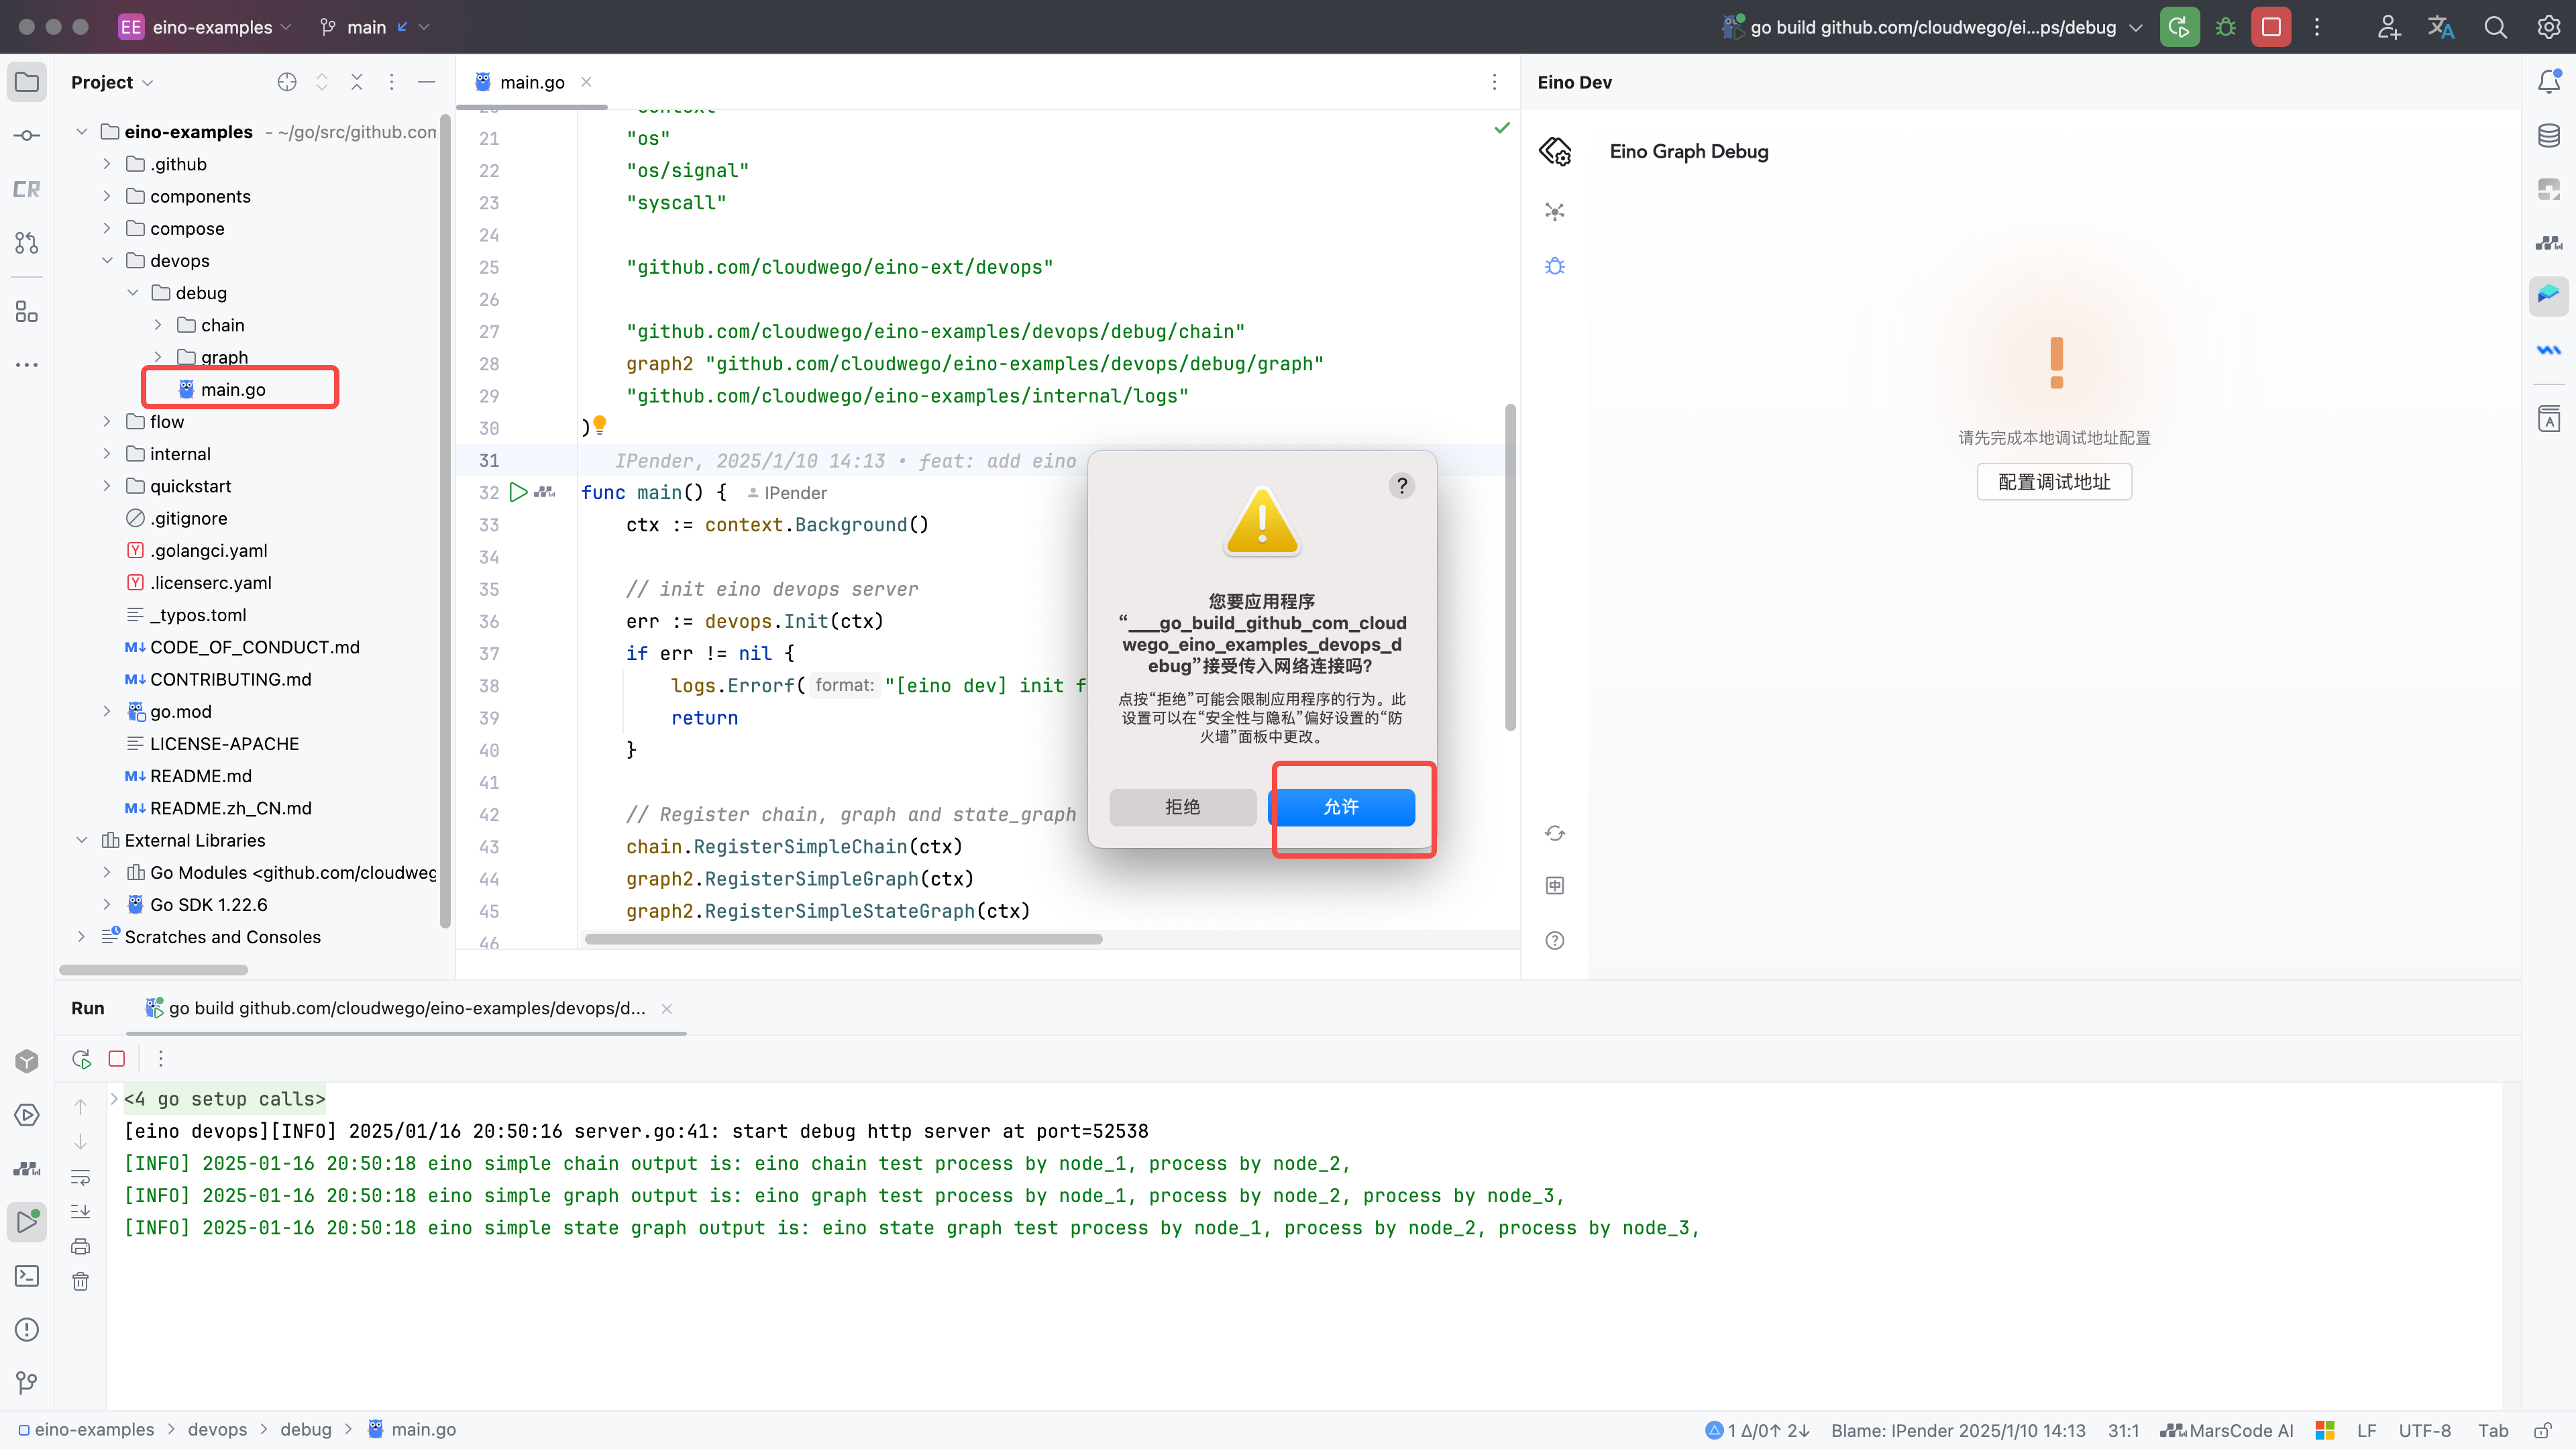
Open eino-examples/devops/debug/main.go and run main.go. The plugin launches a local HTTP service to connect to your process; allow network access if prompted.
Configure Debug Address
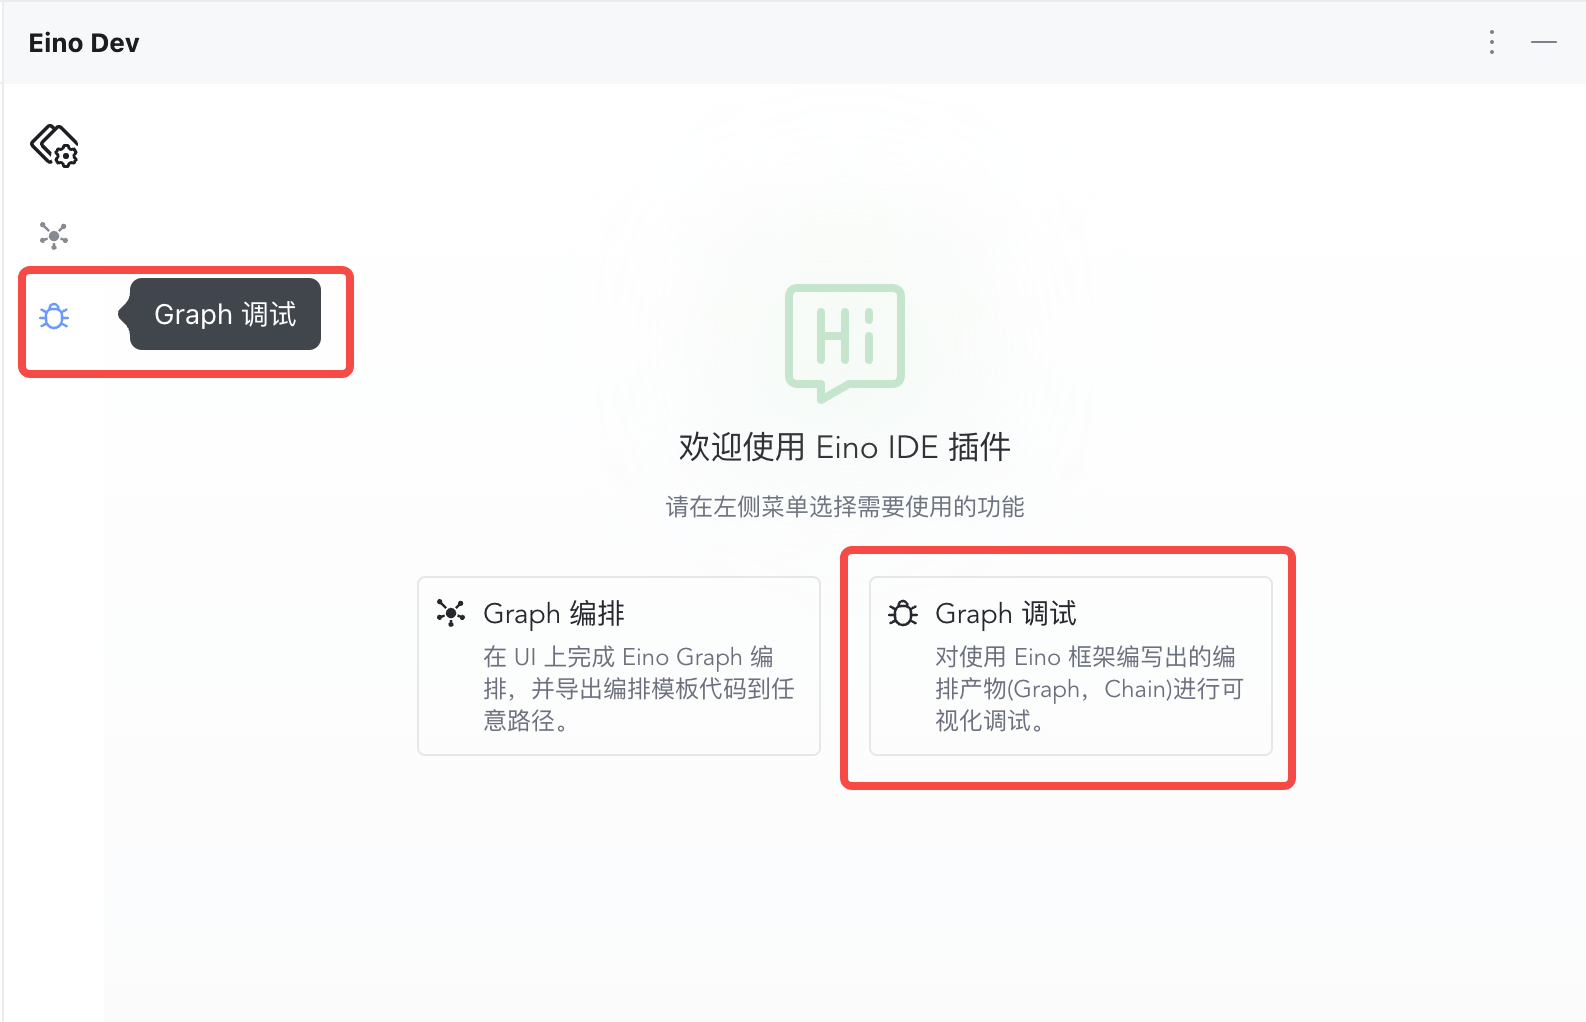
1) Click the debug feature entry on the left or center to open configuration
|
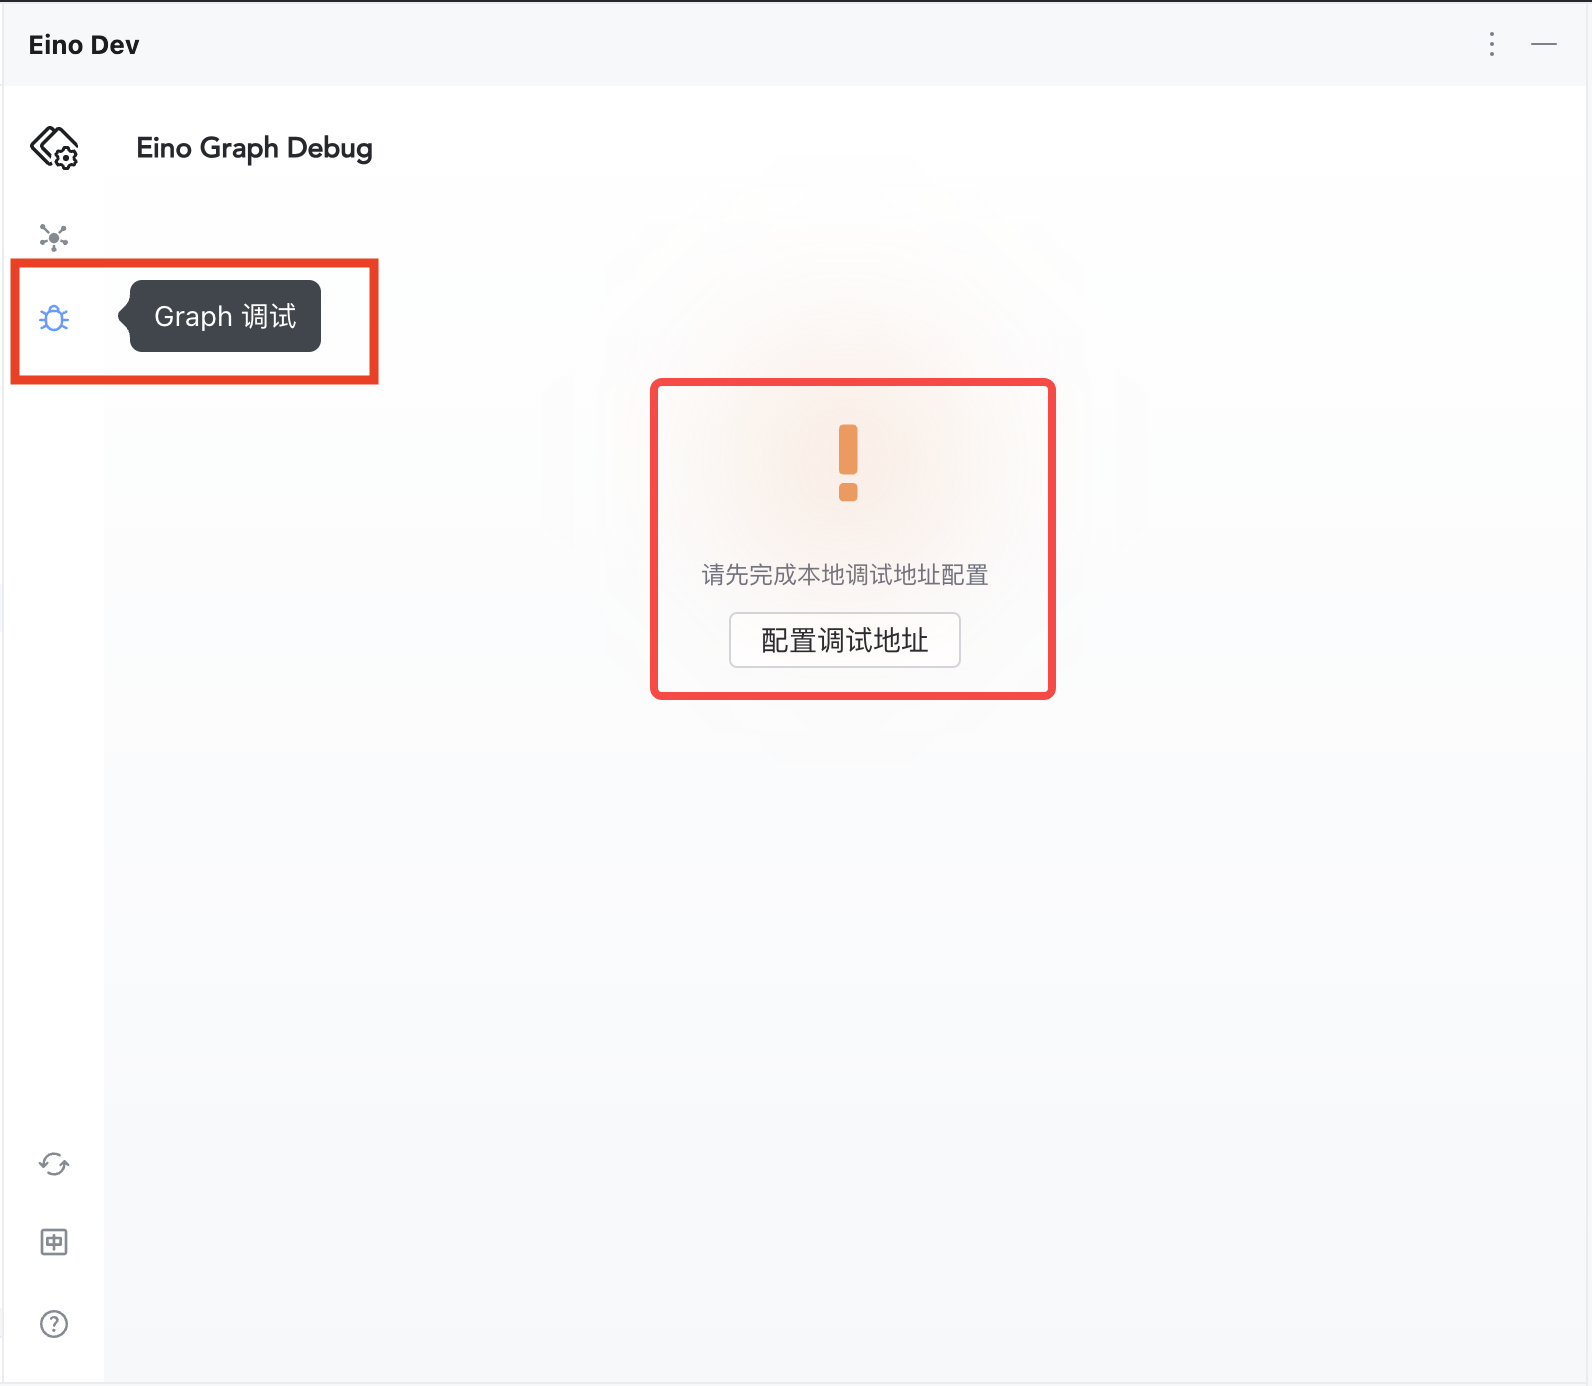
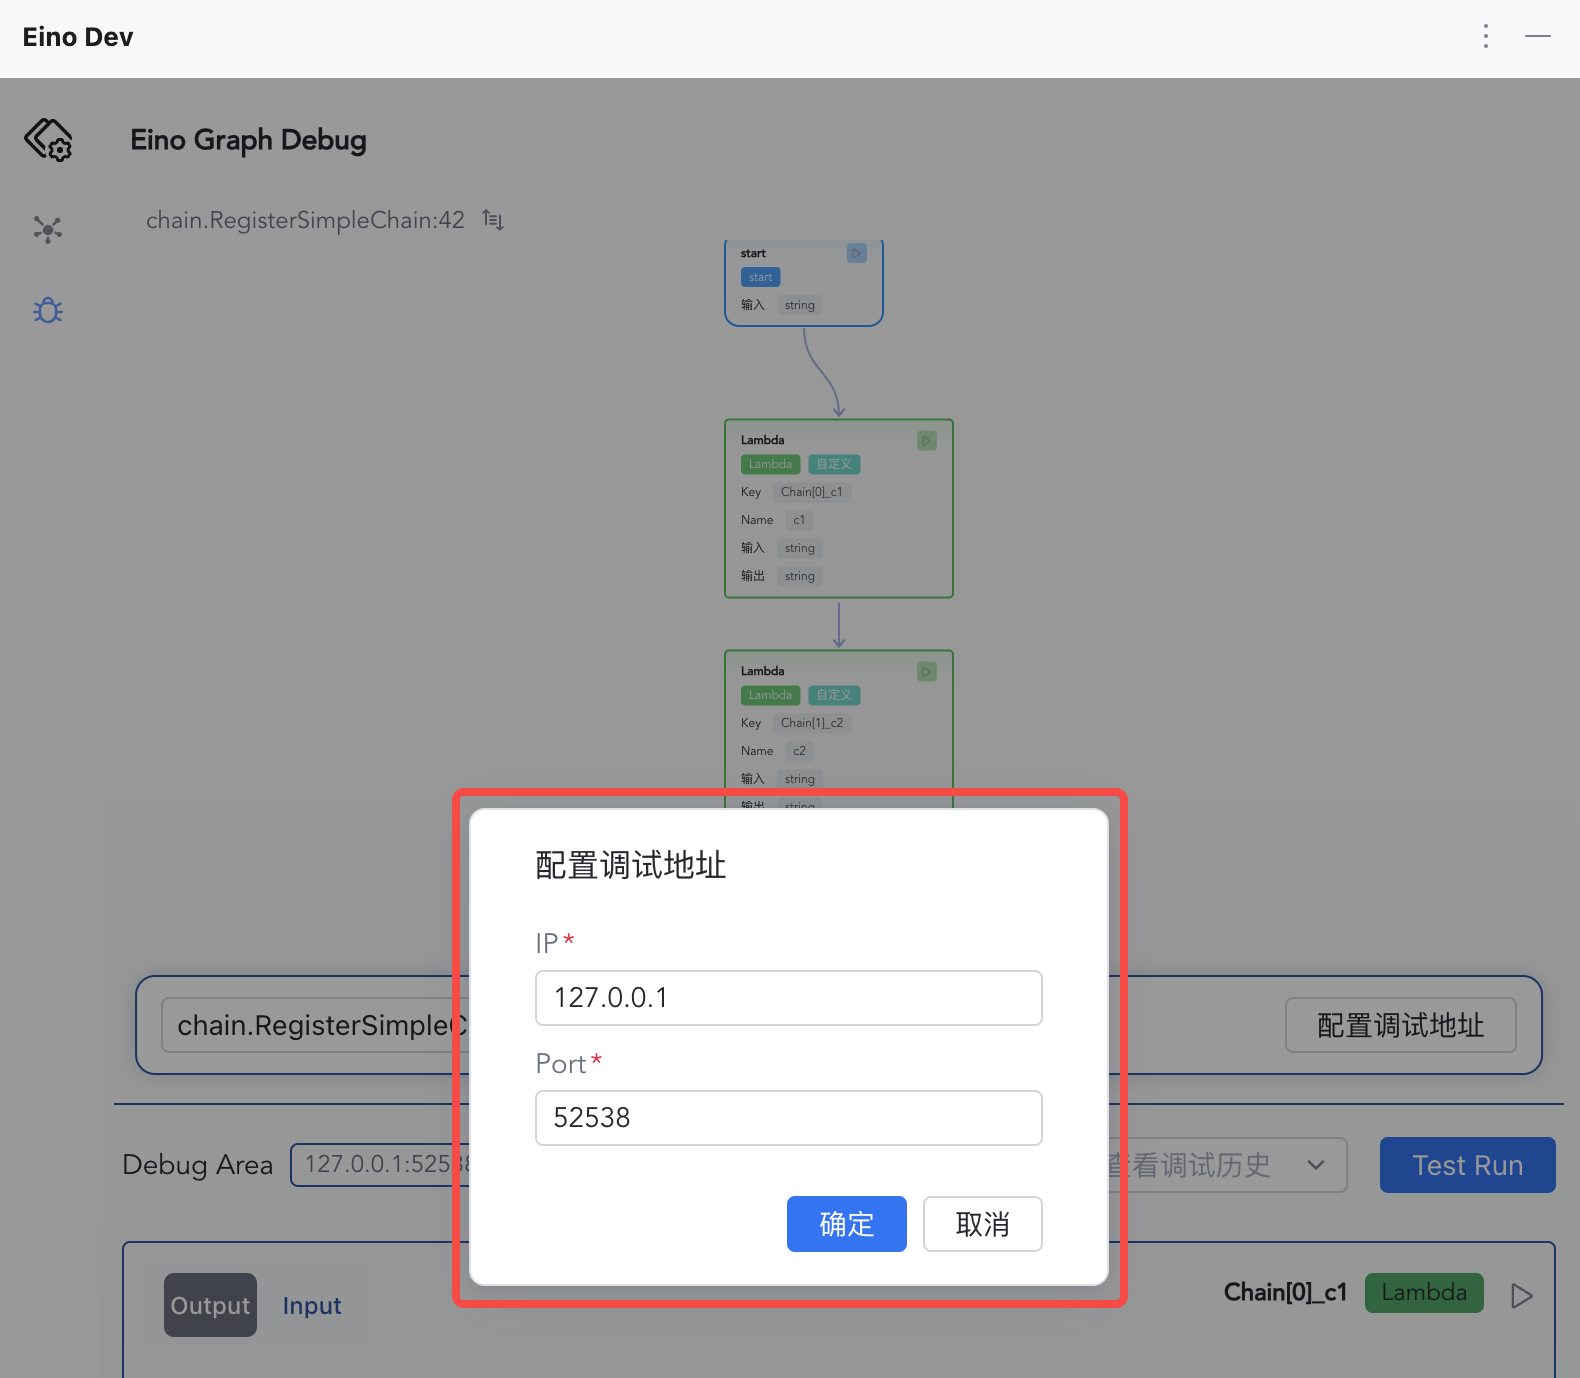
2) Click “Configure Address”
|
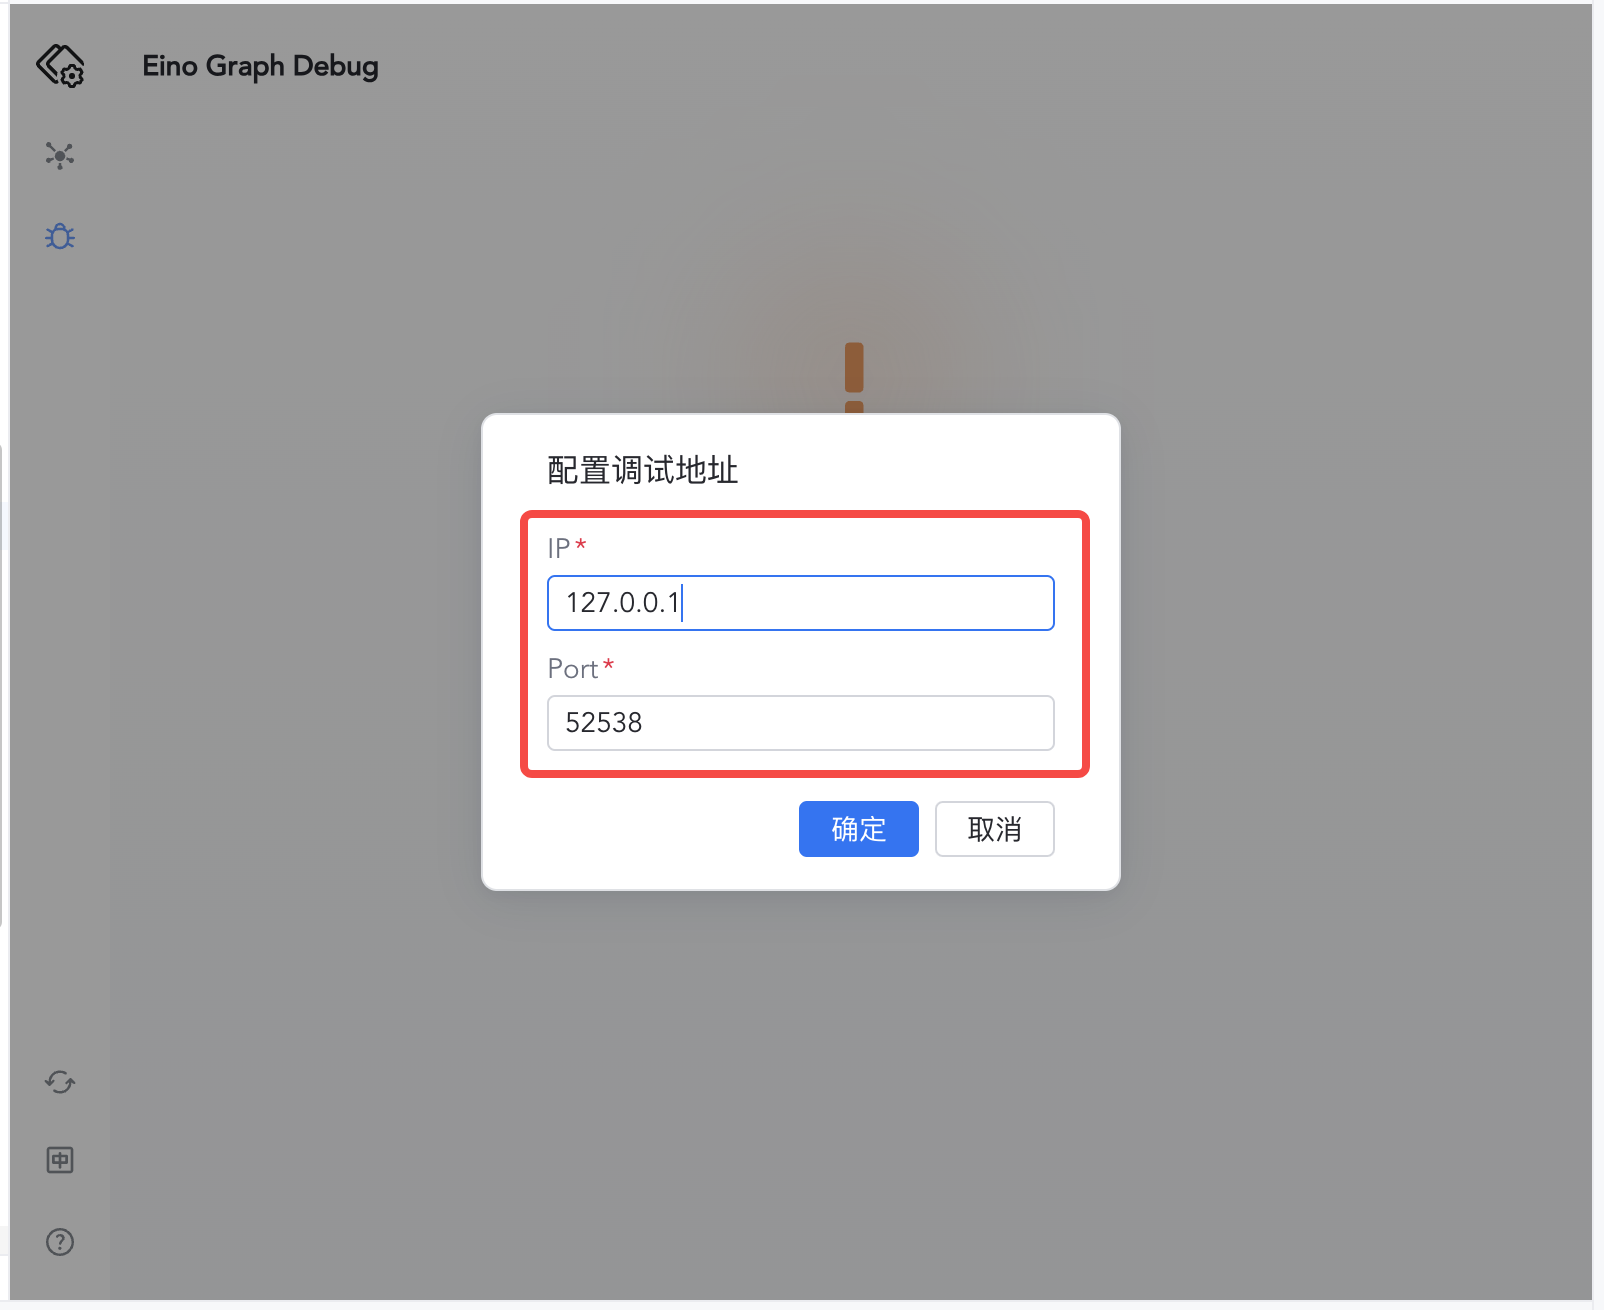
3) Enter 127.0.0.1:52538
|
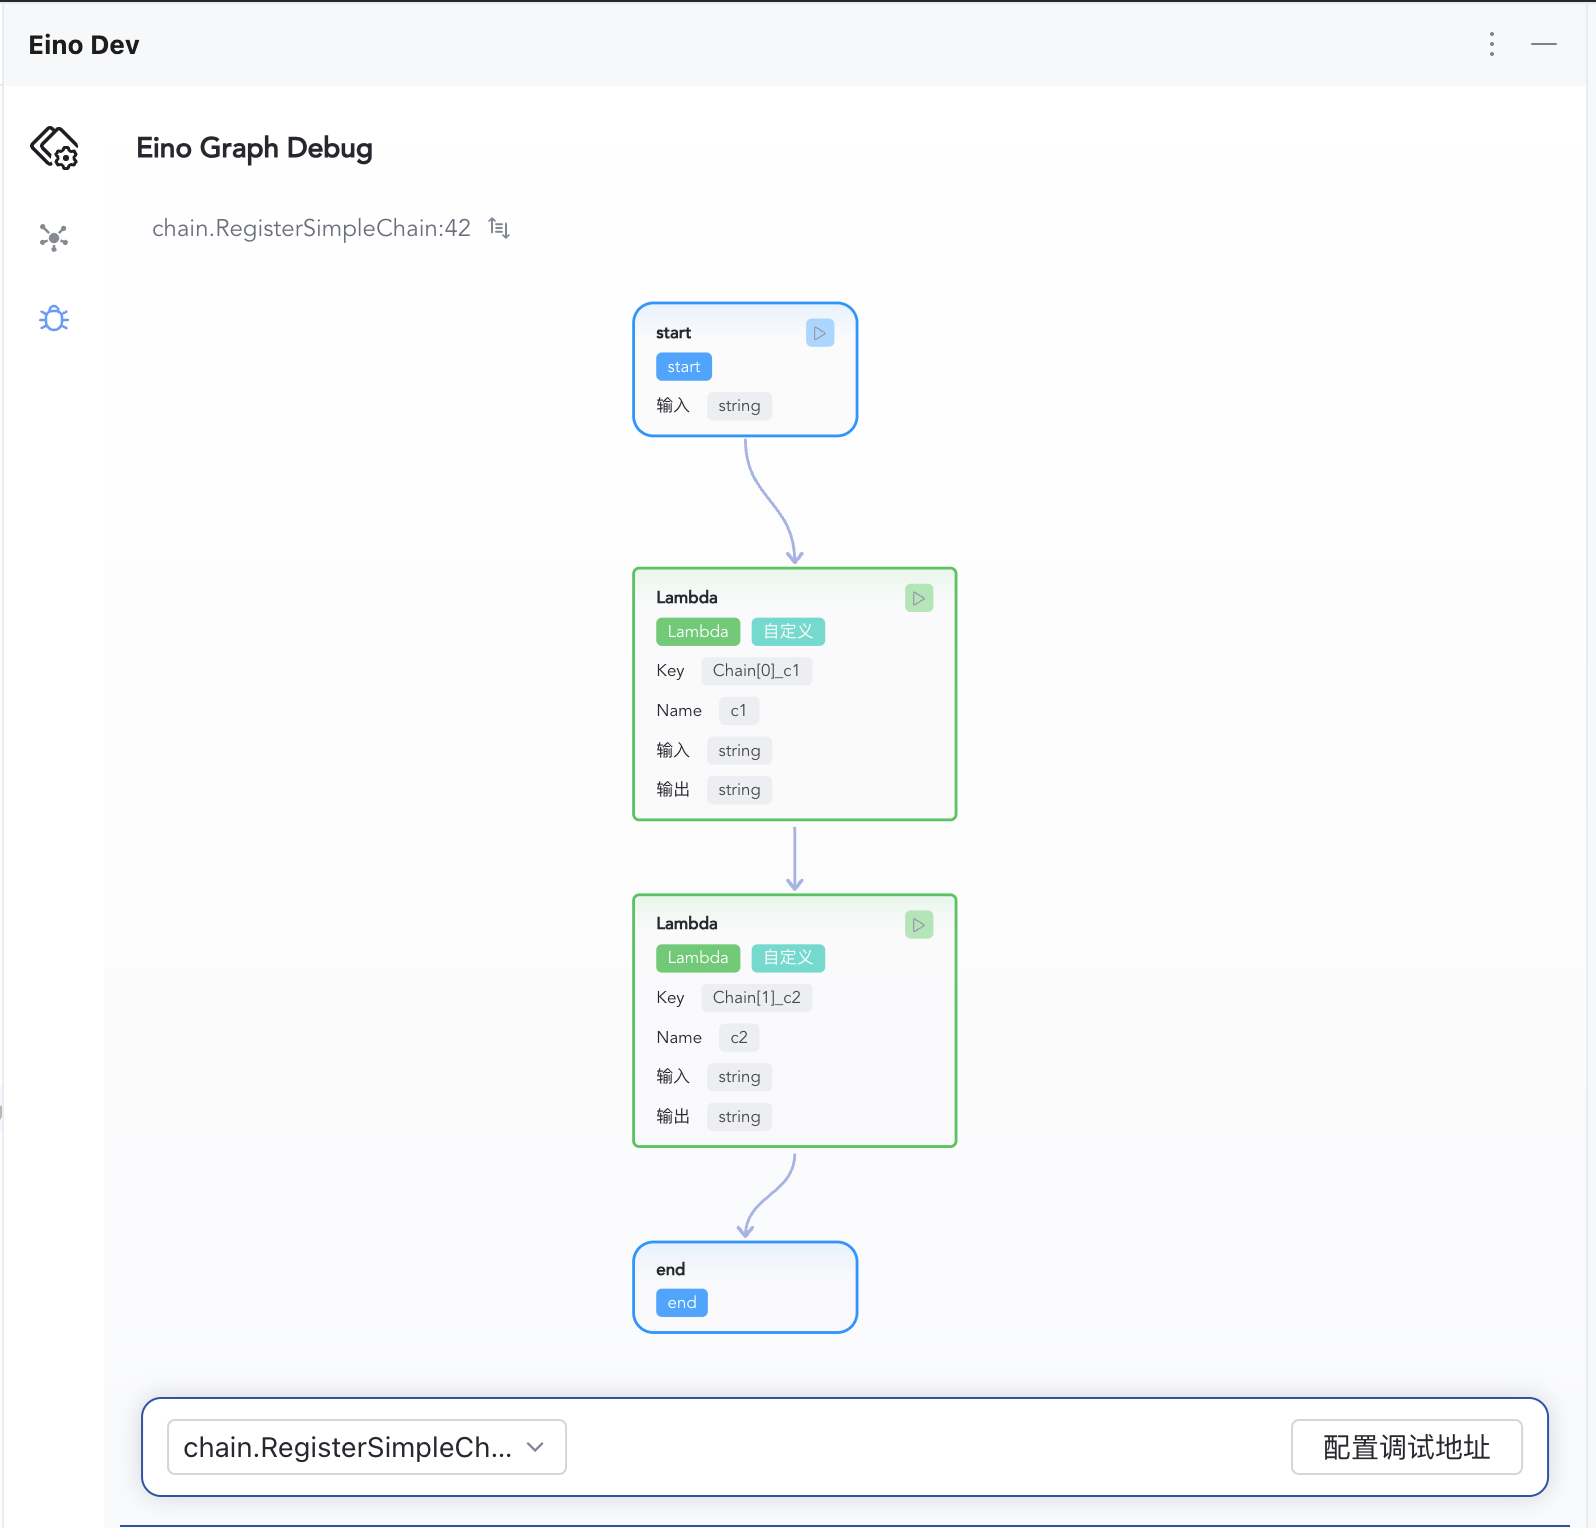
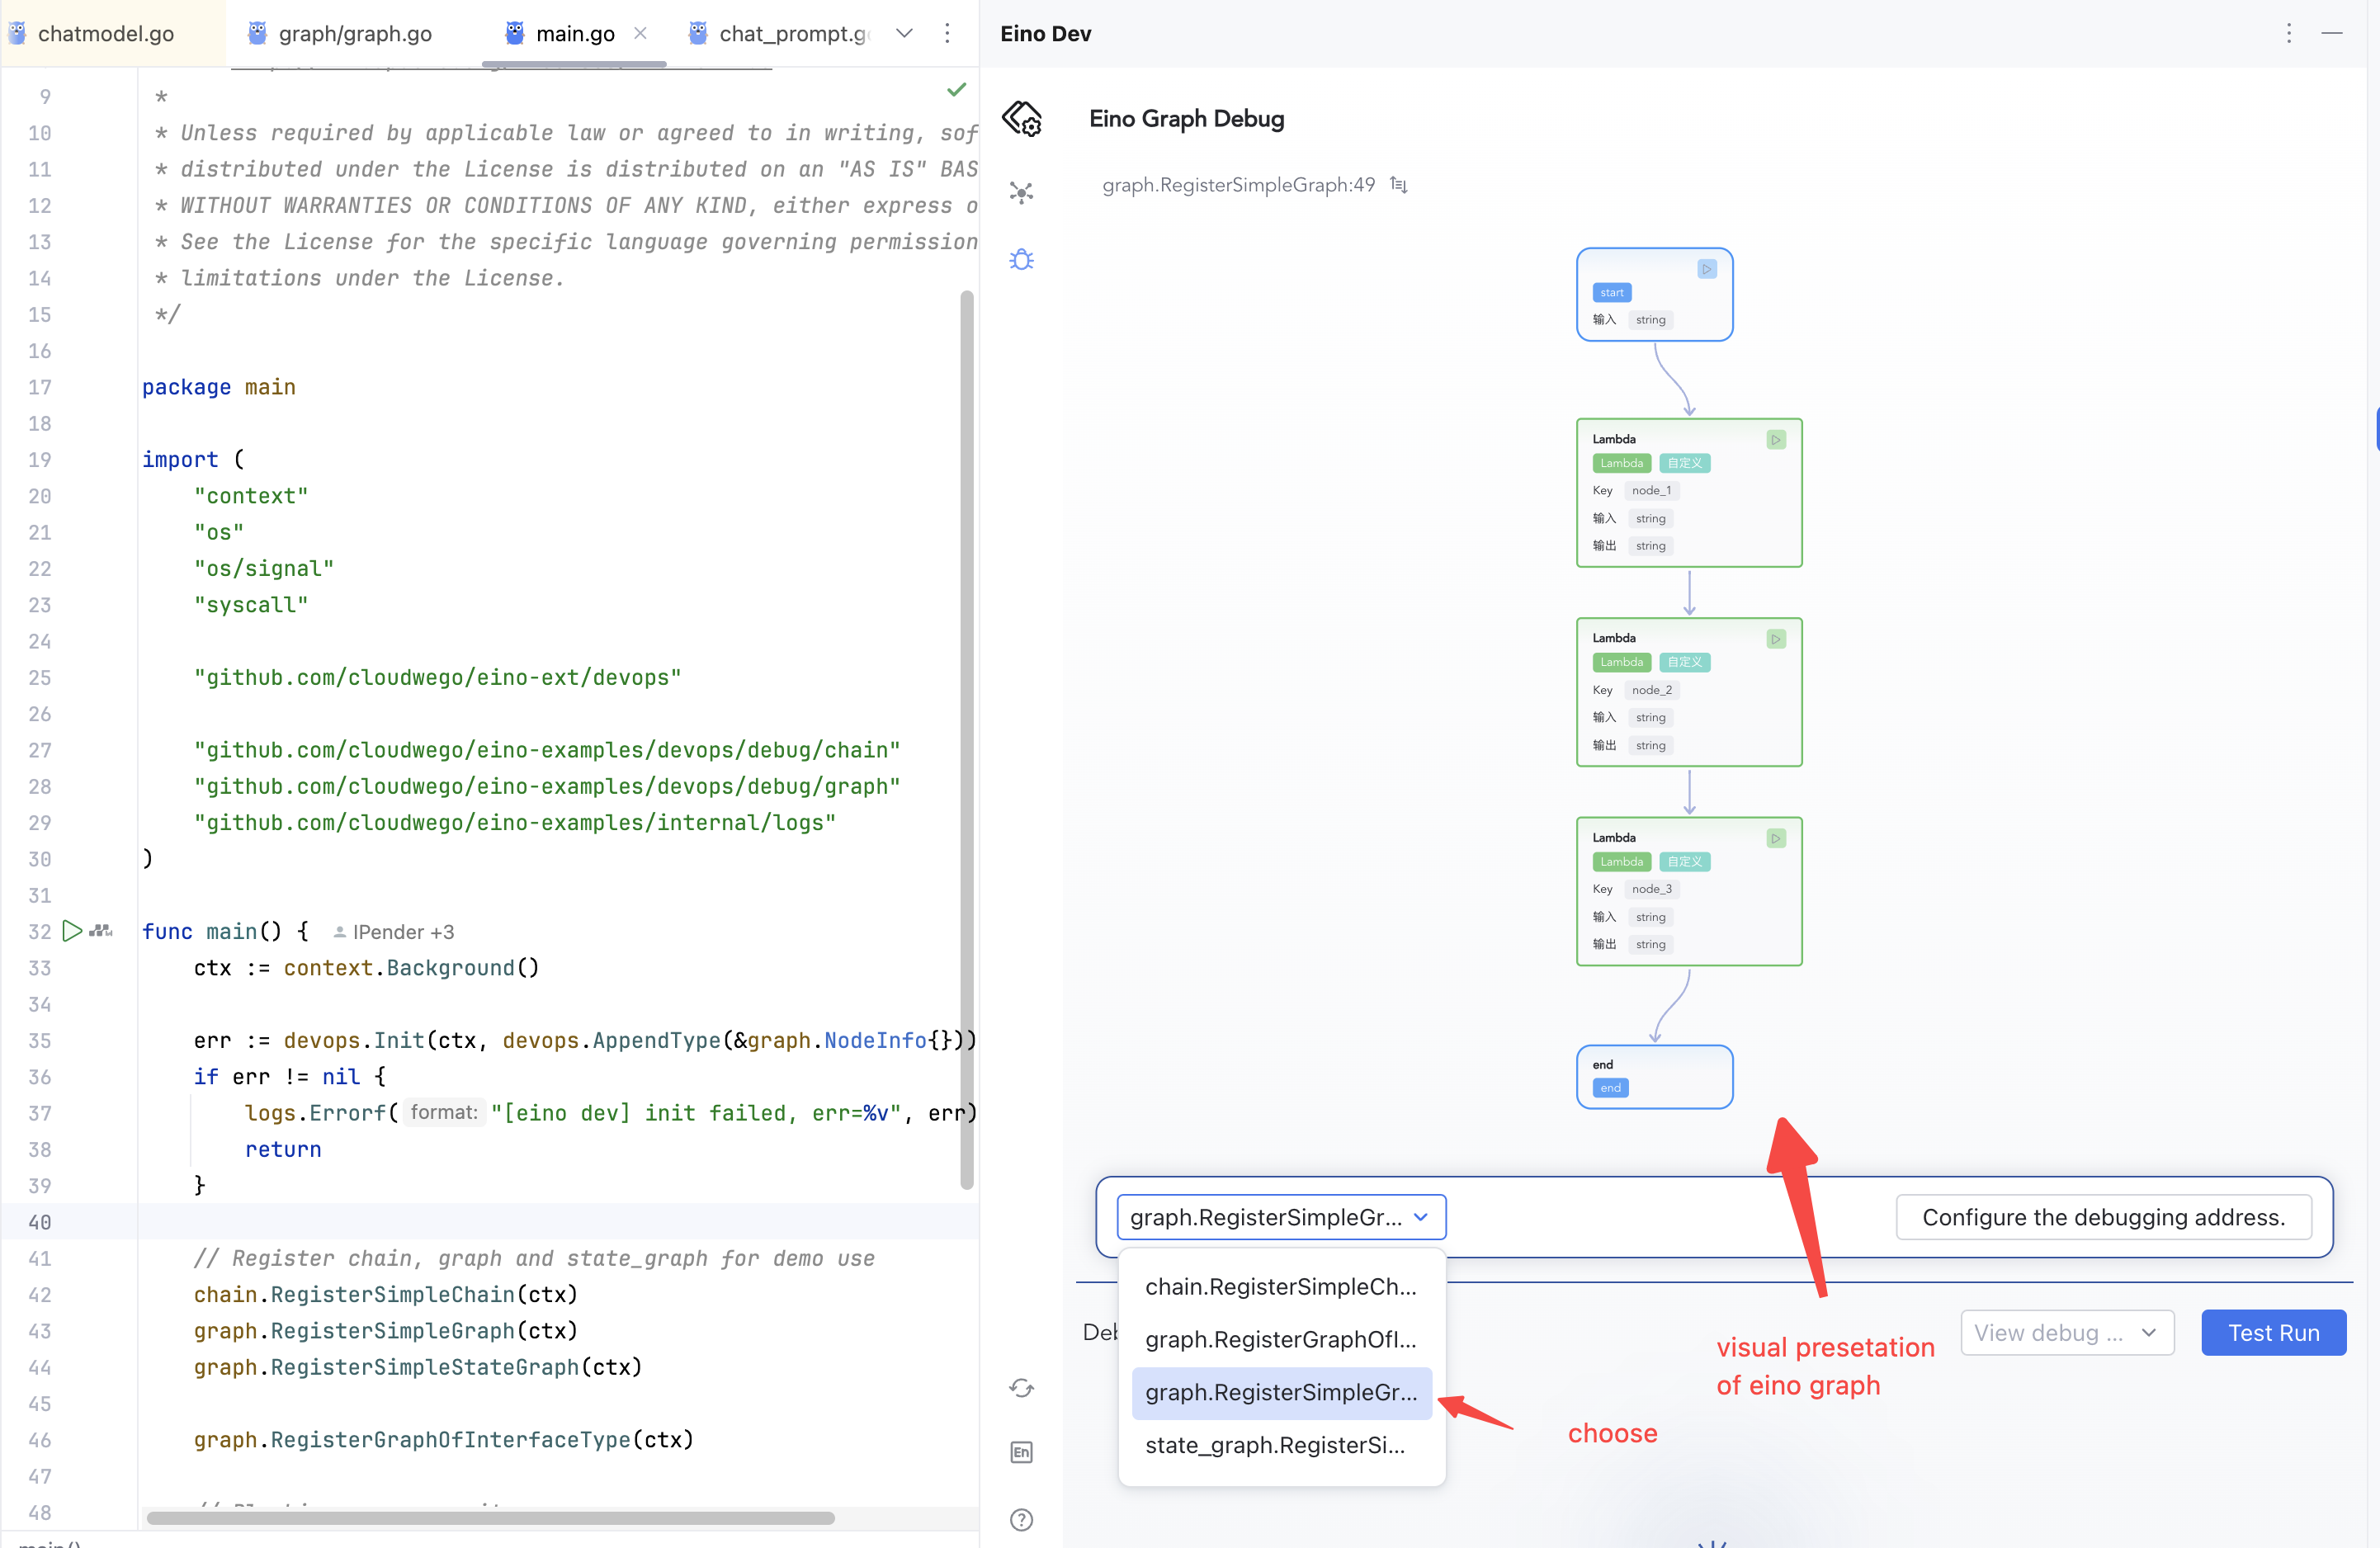
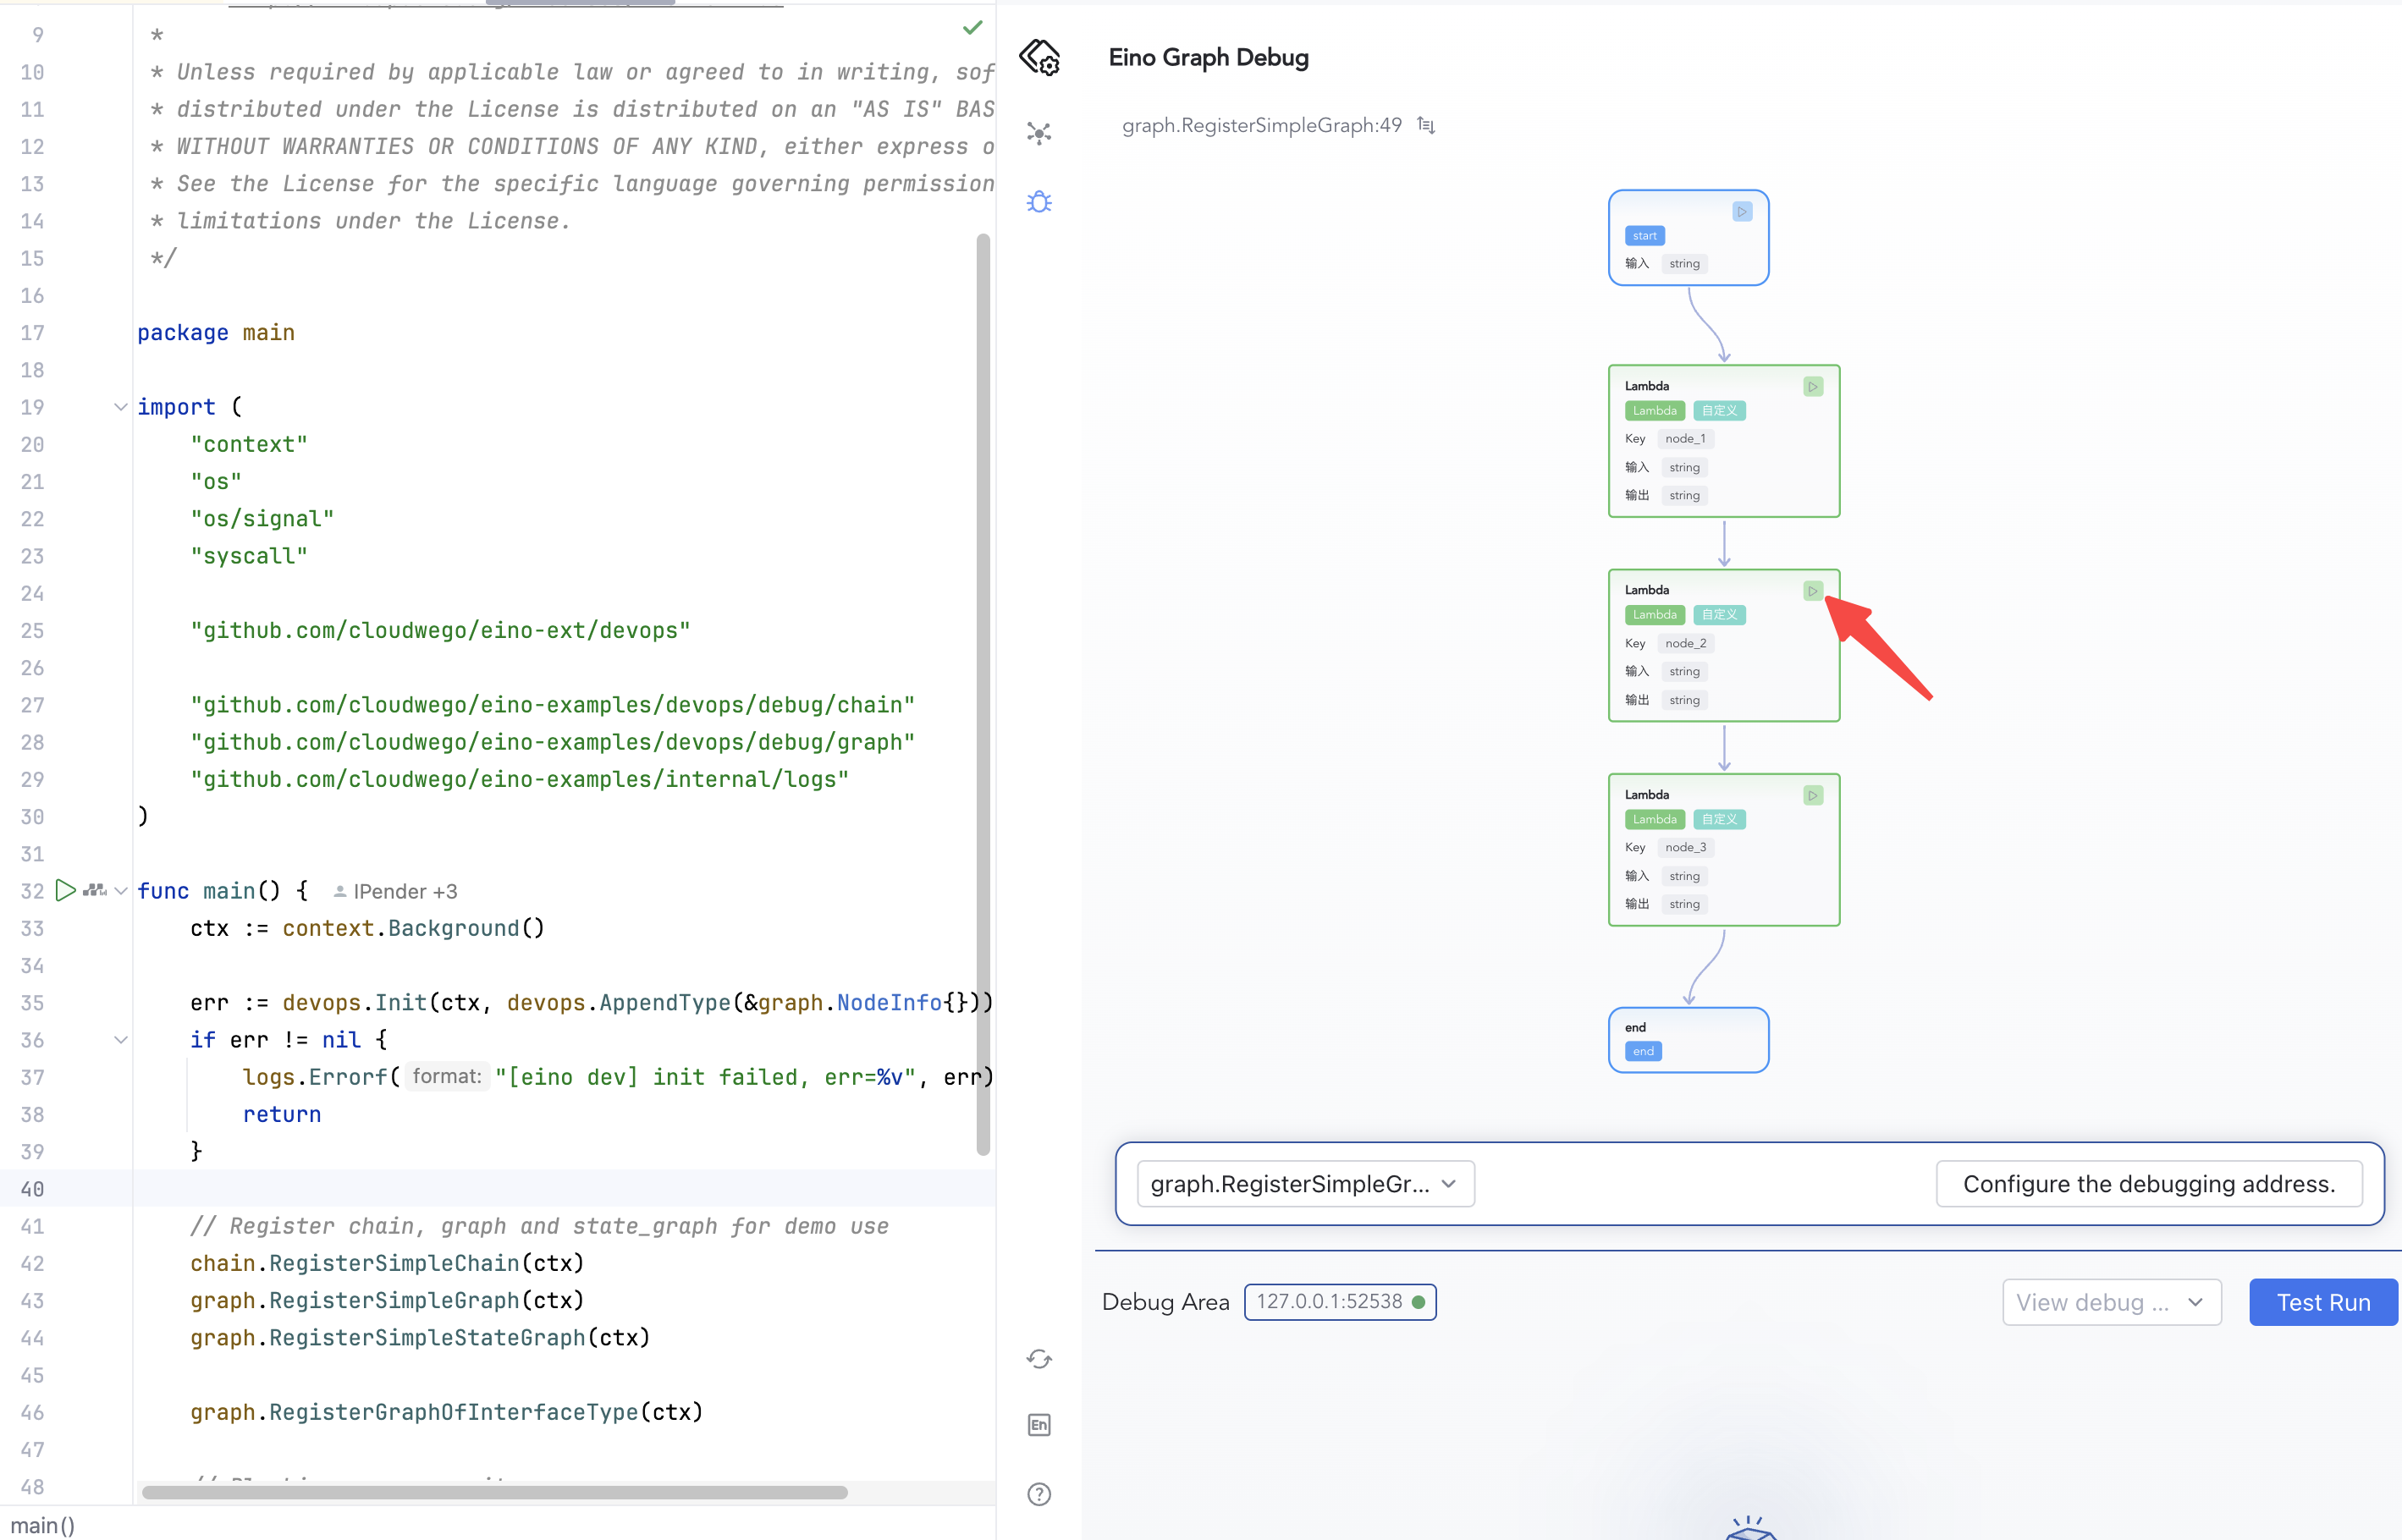
4) Confirm to enter the debug view, then select the Graph to debug
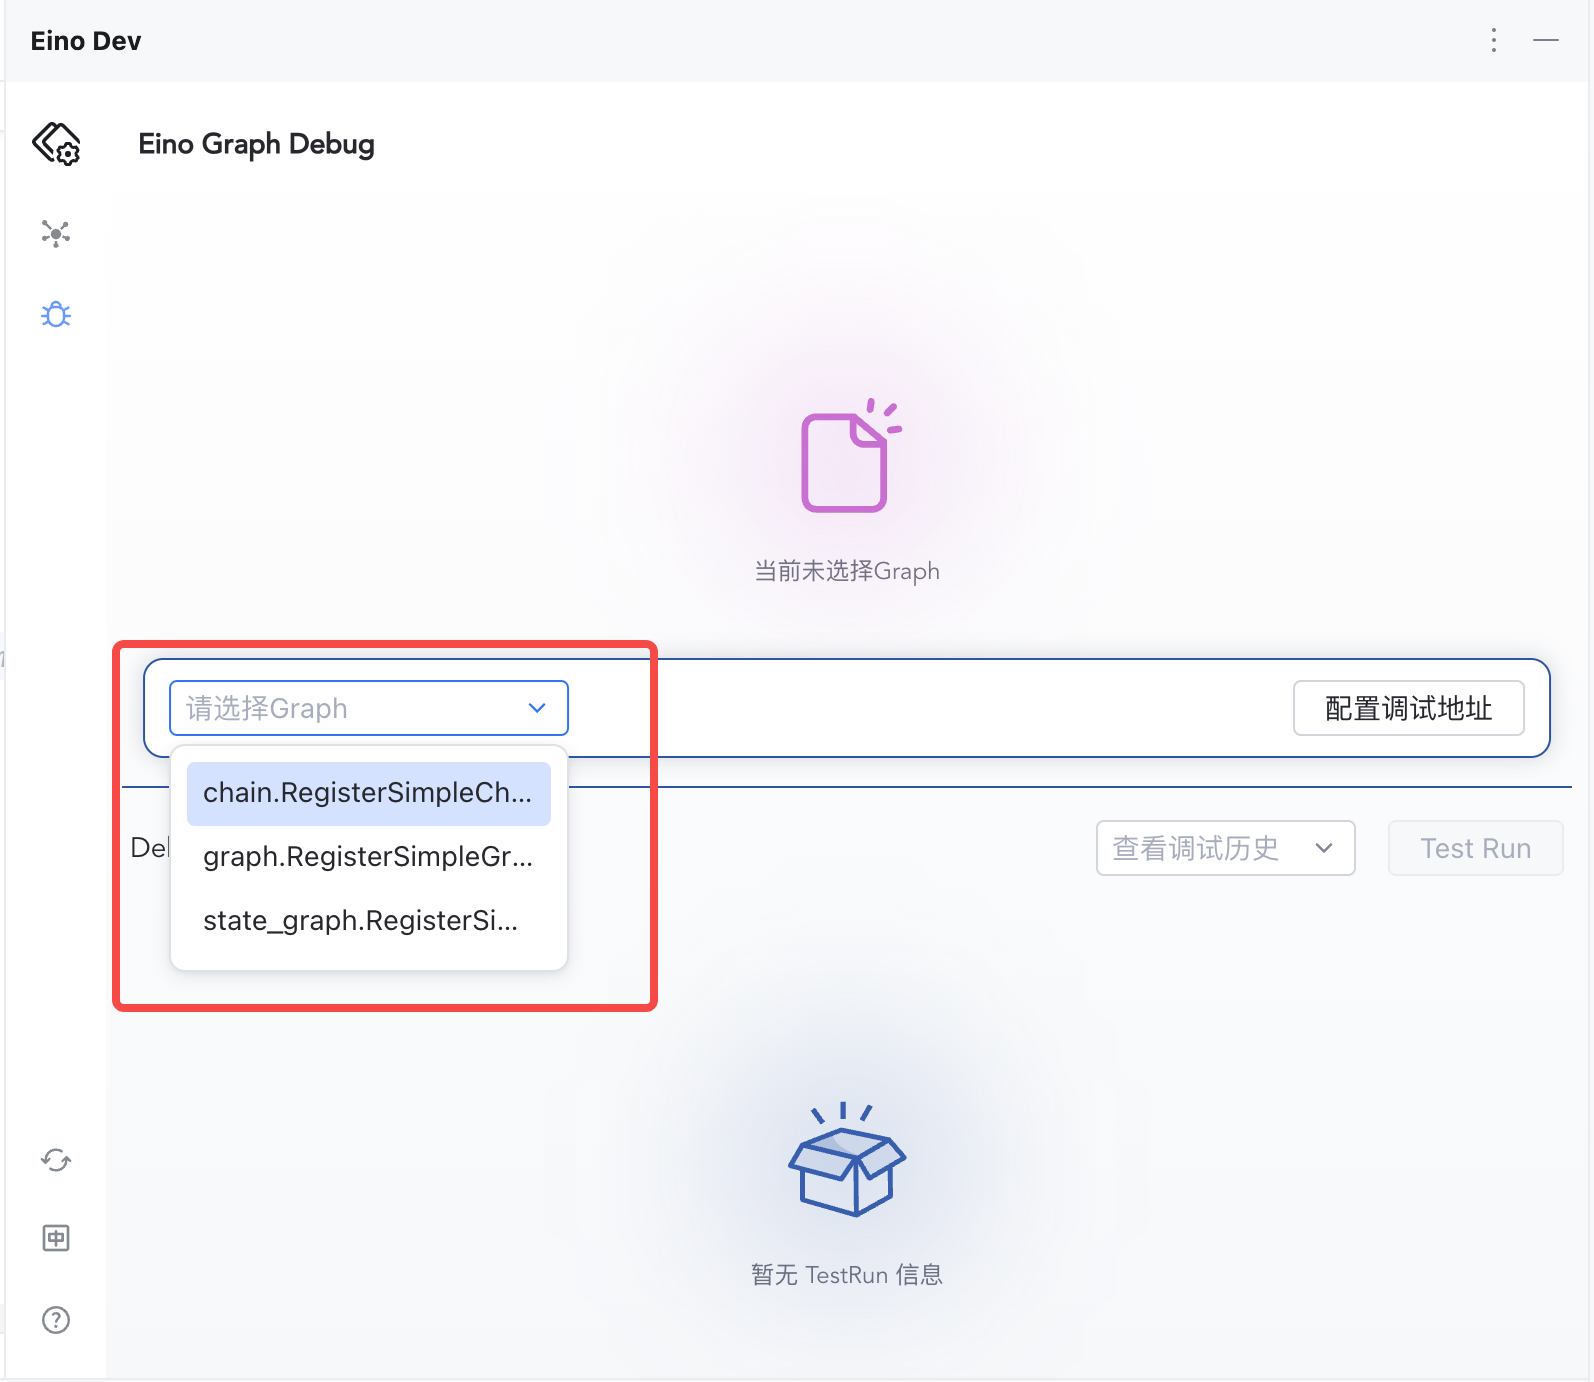
|
Start Debugging
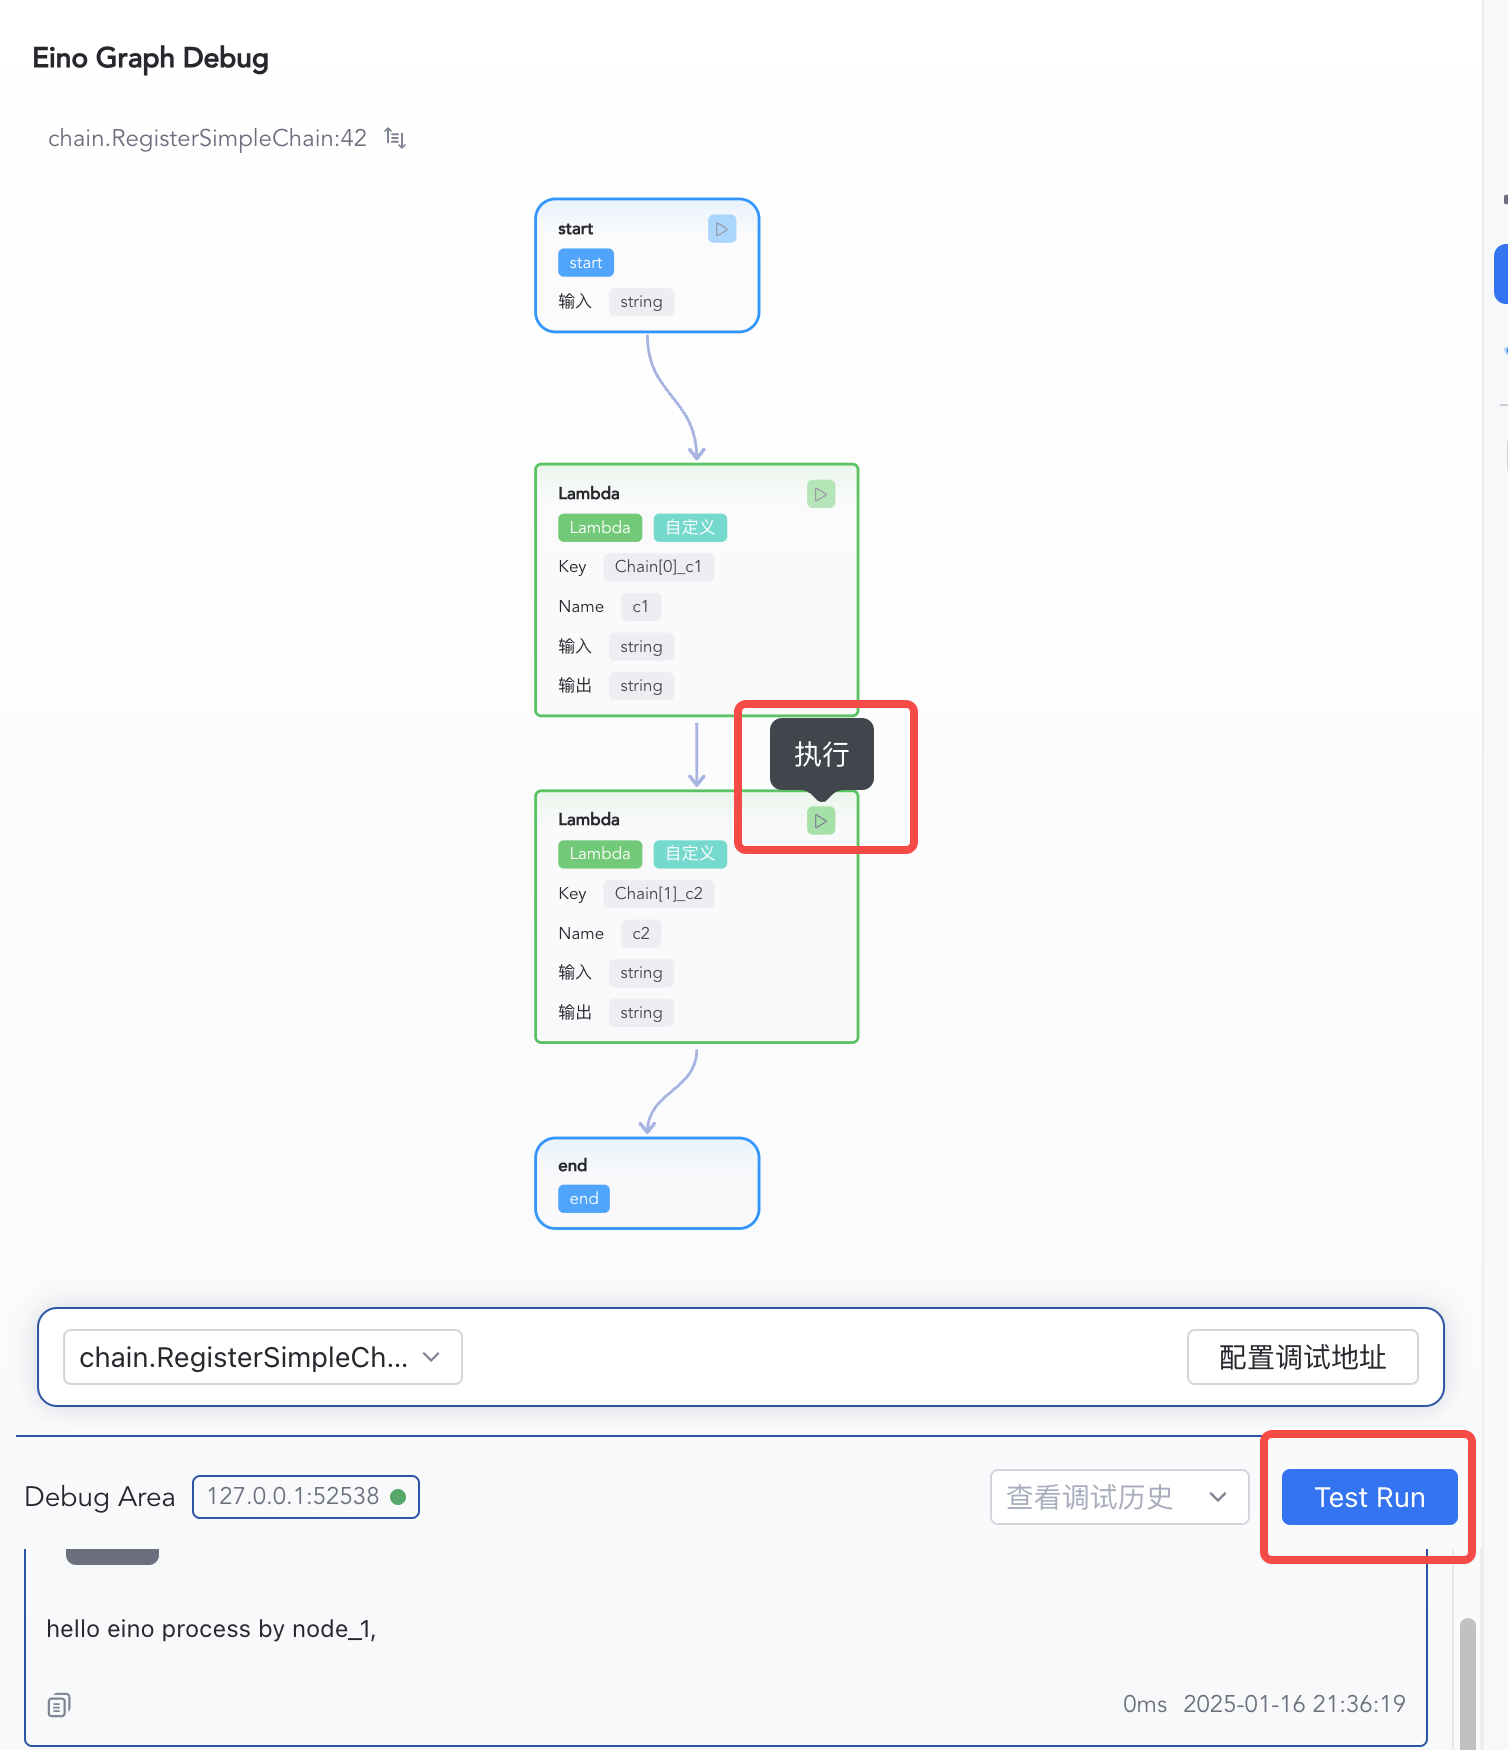
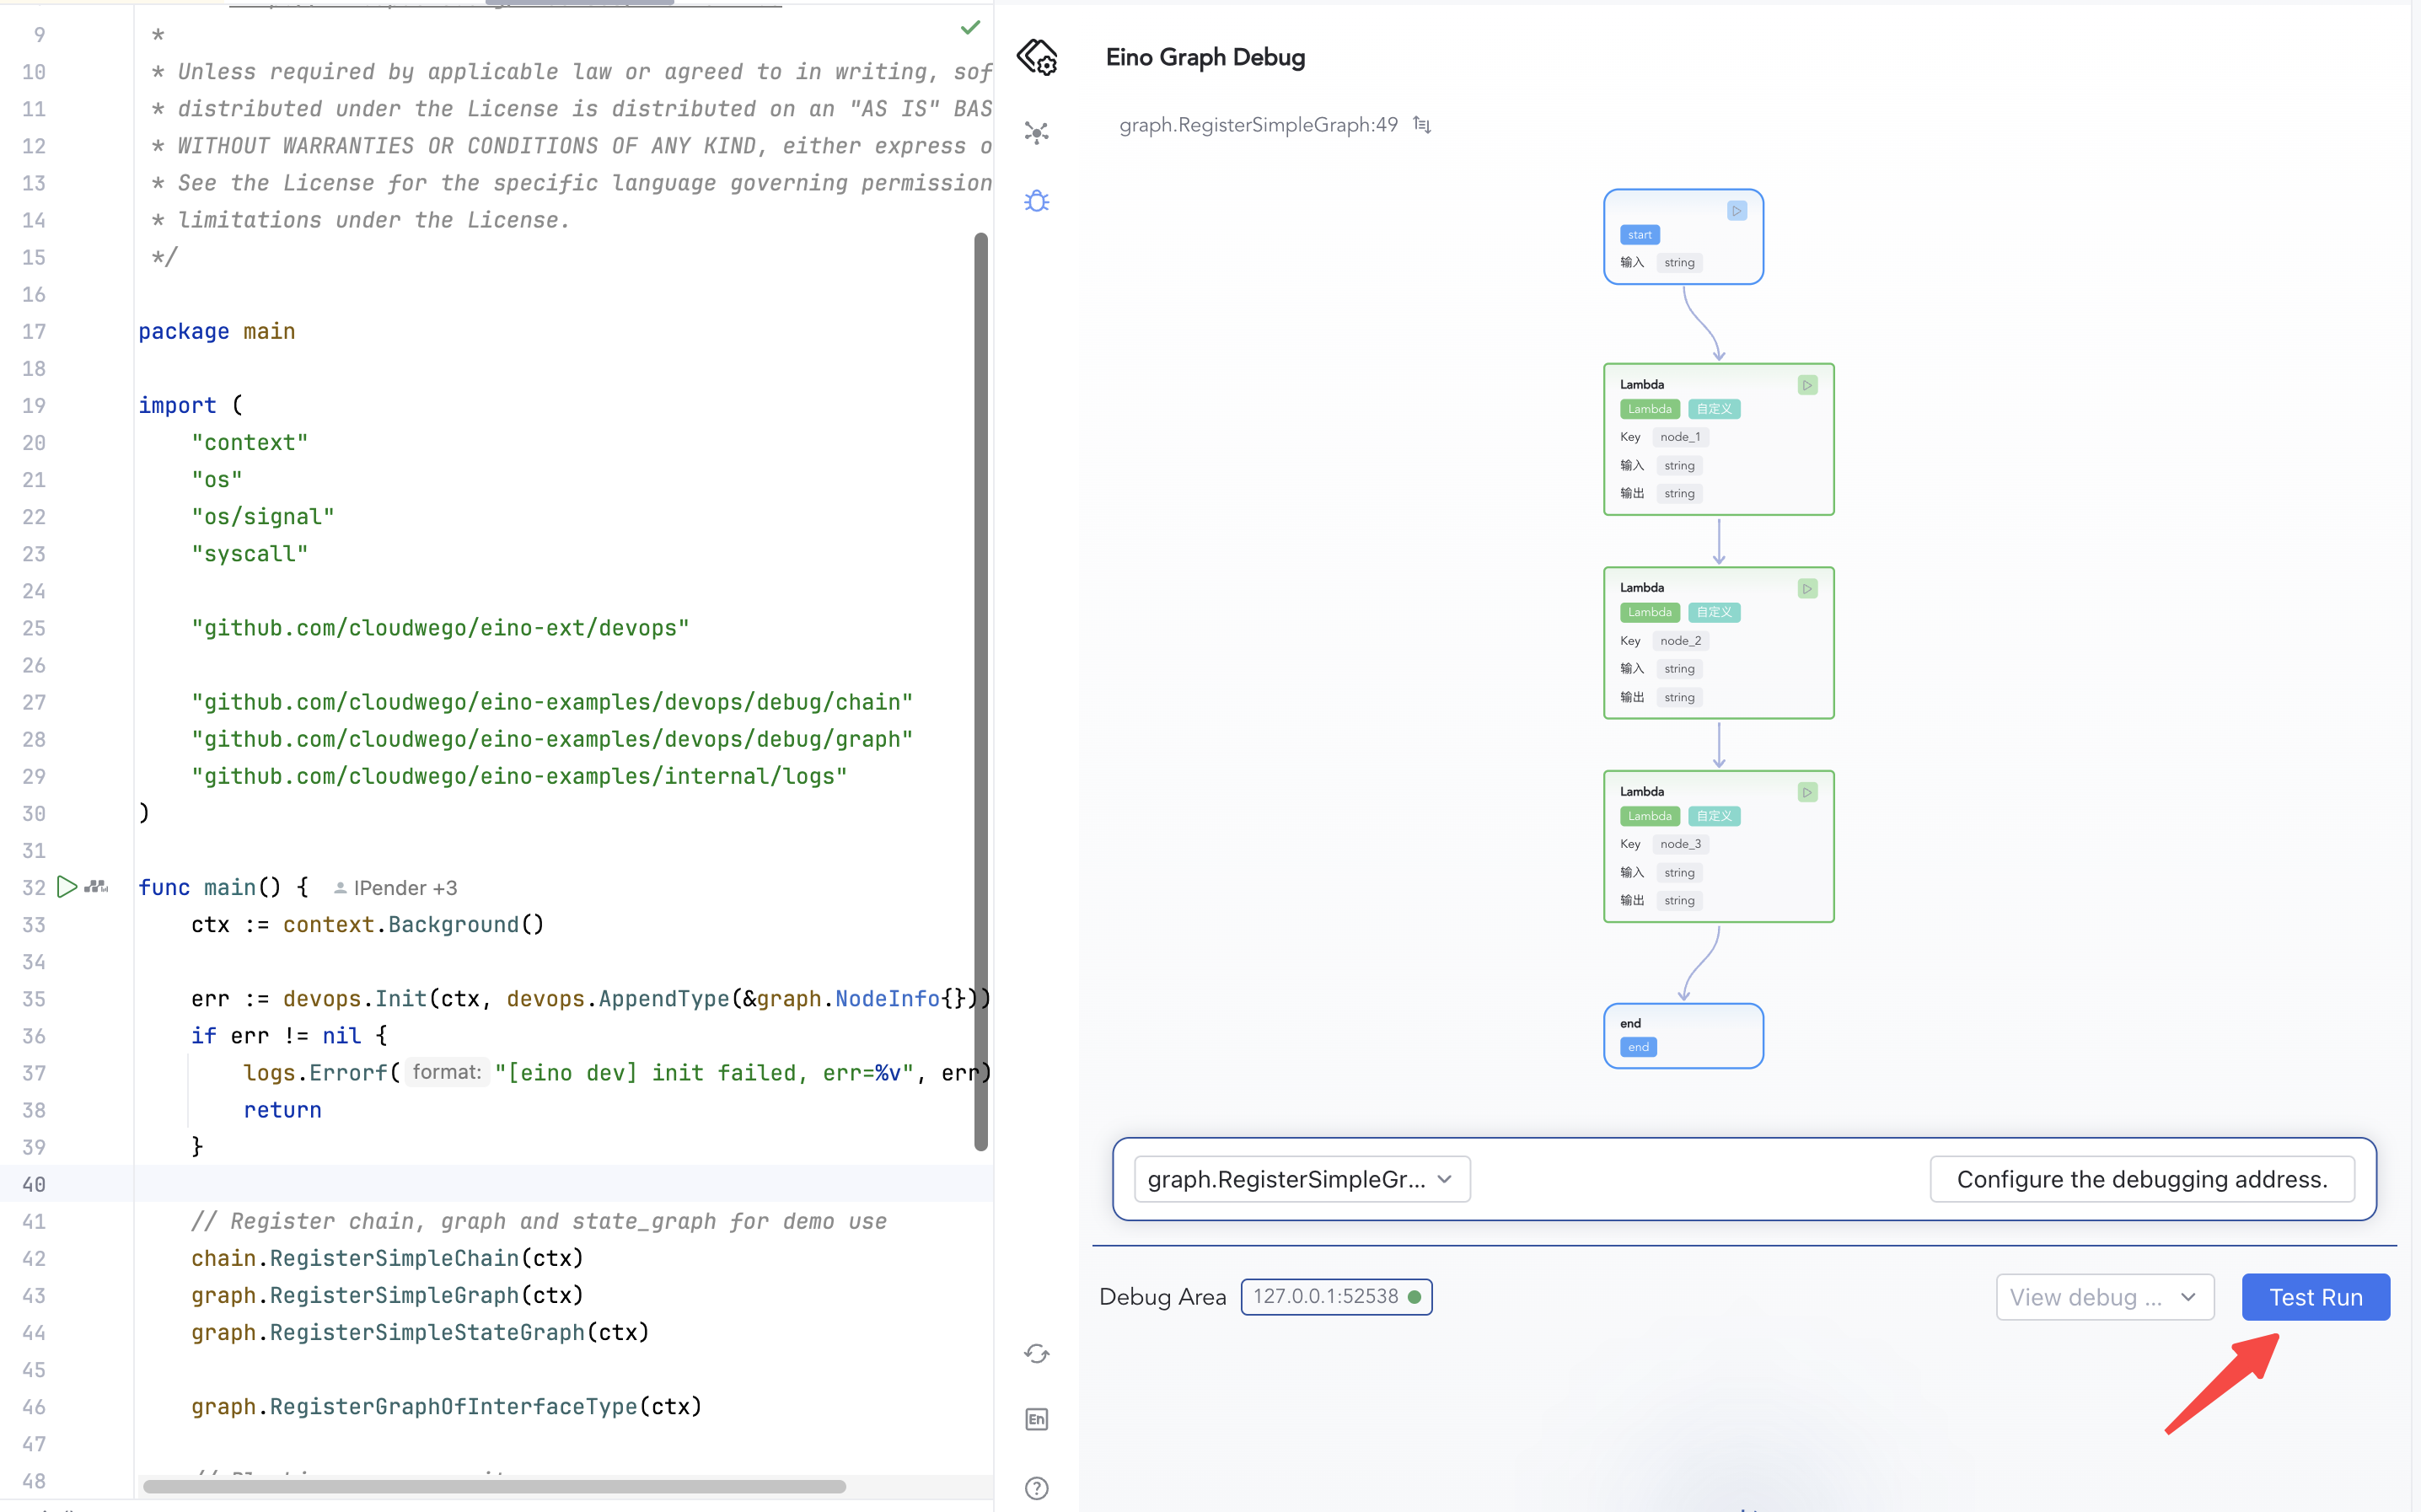
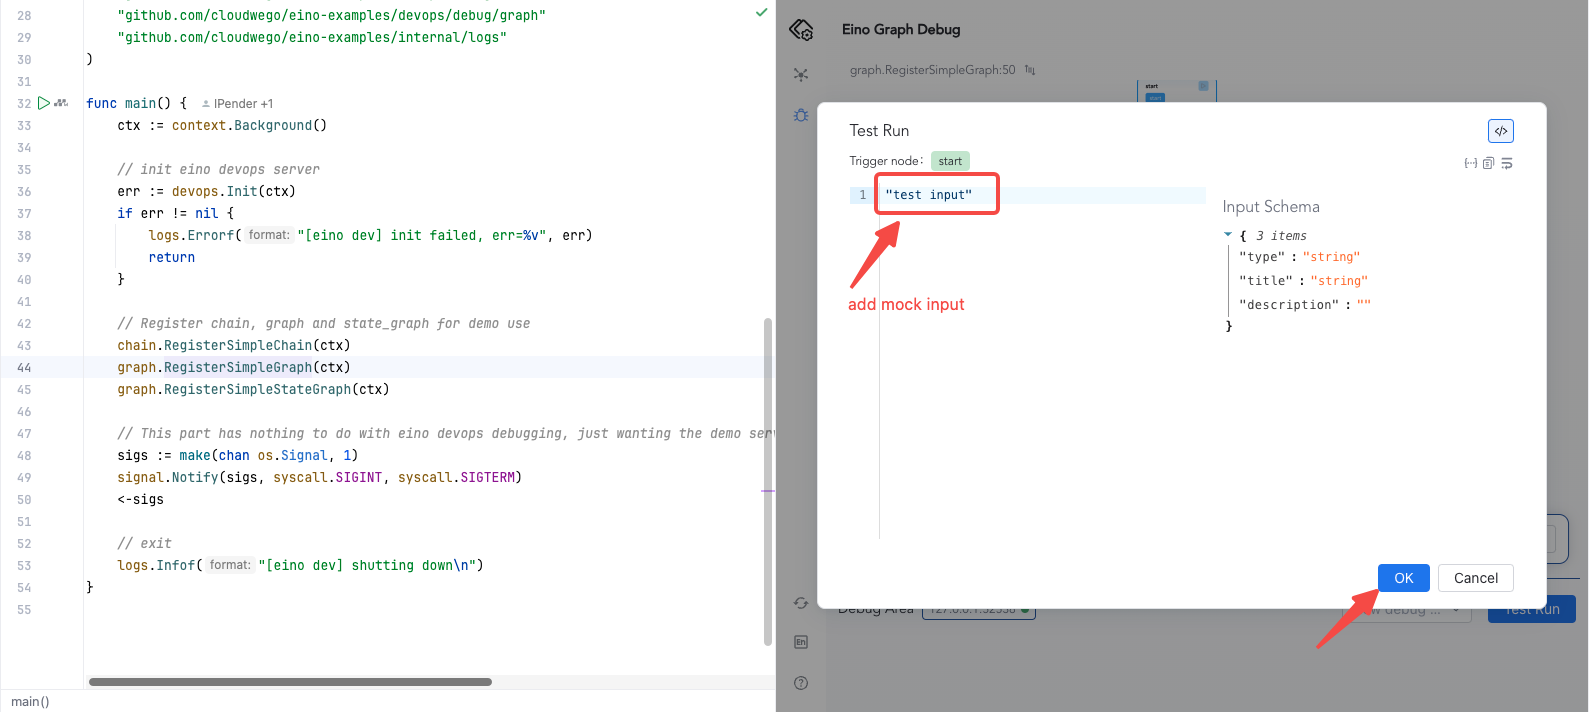
1) Click “Test Run” to start from START
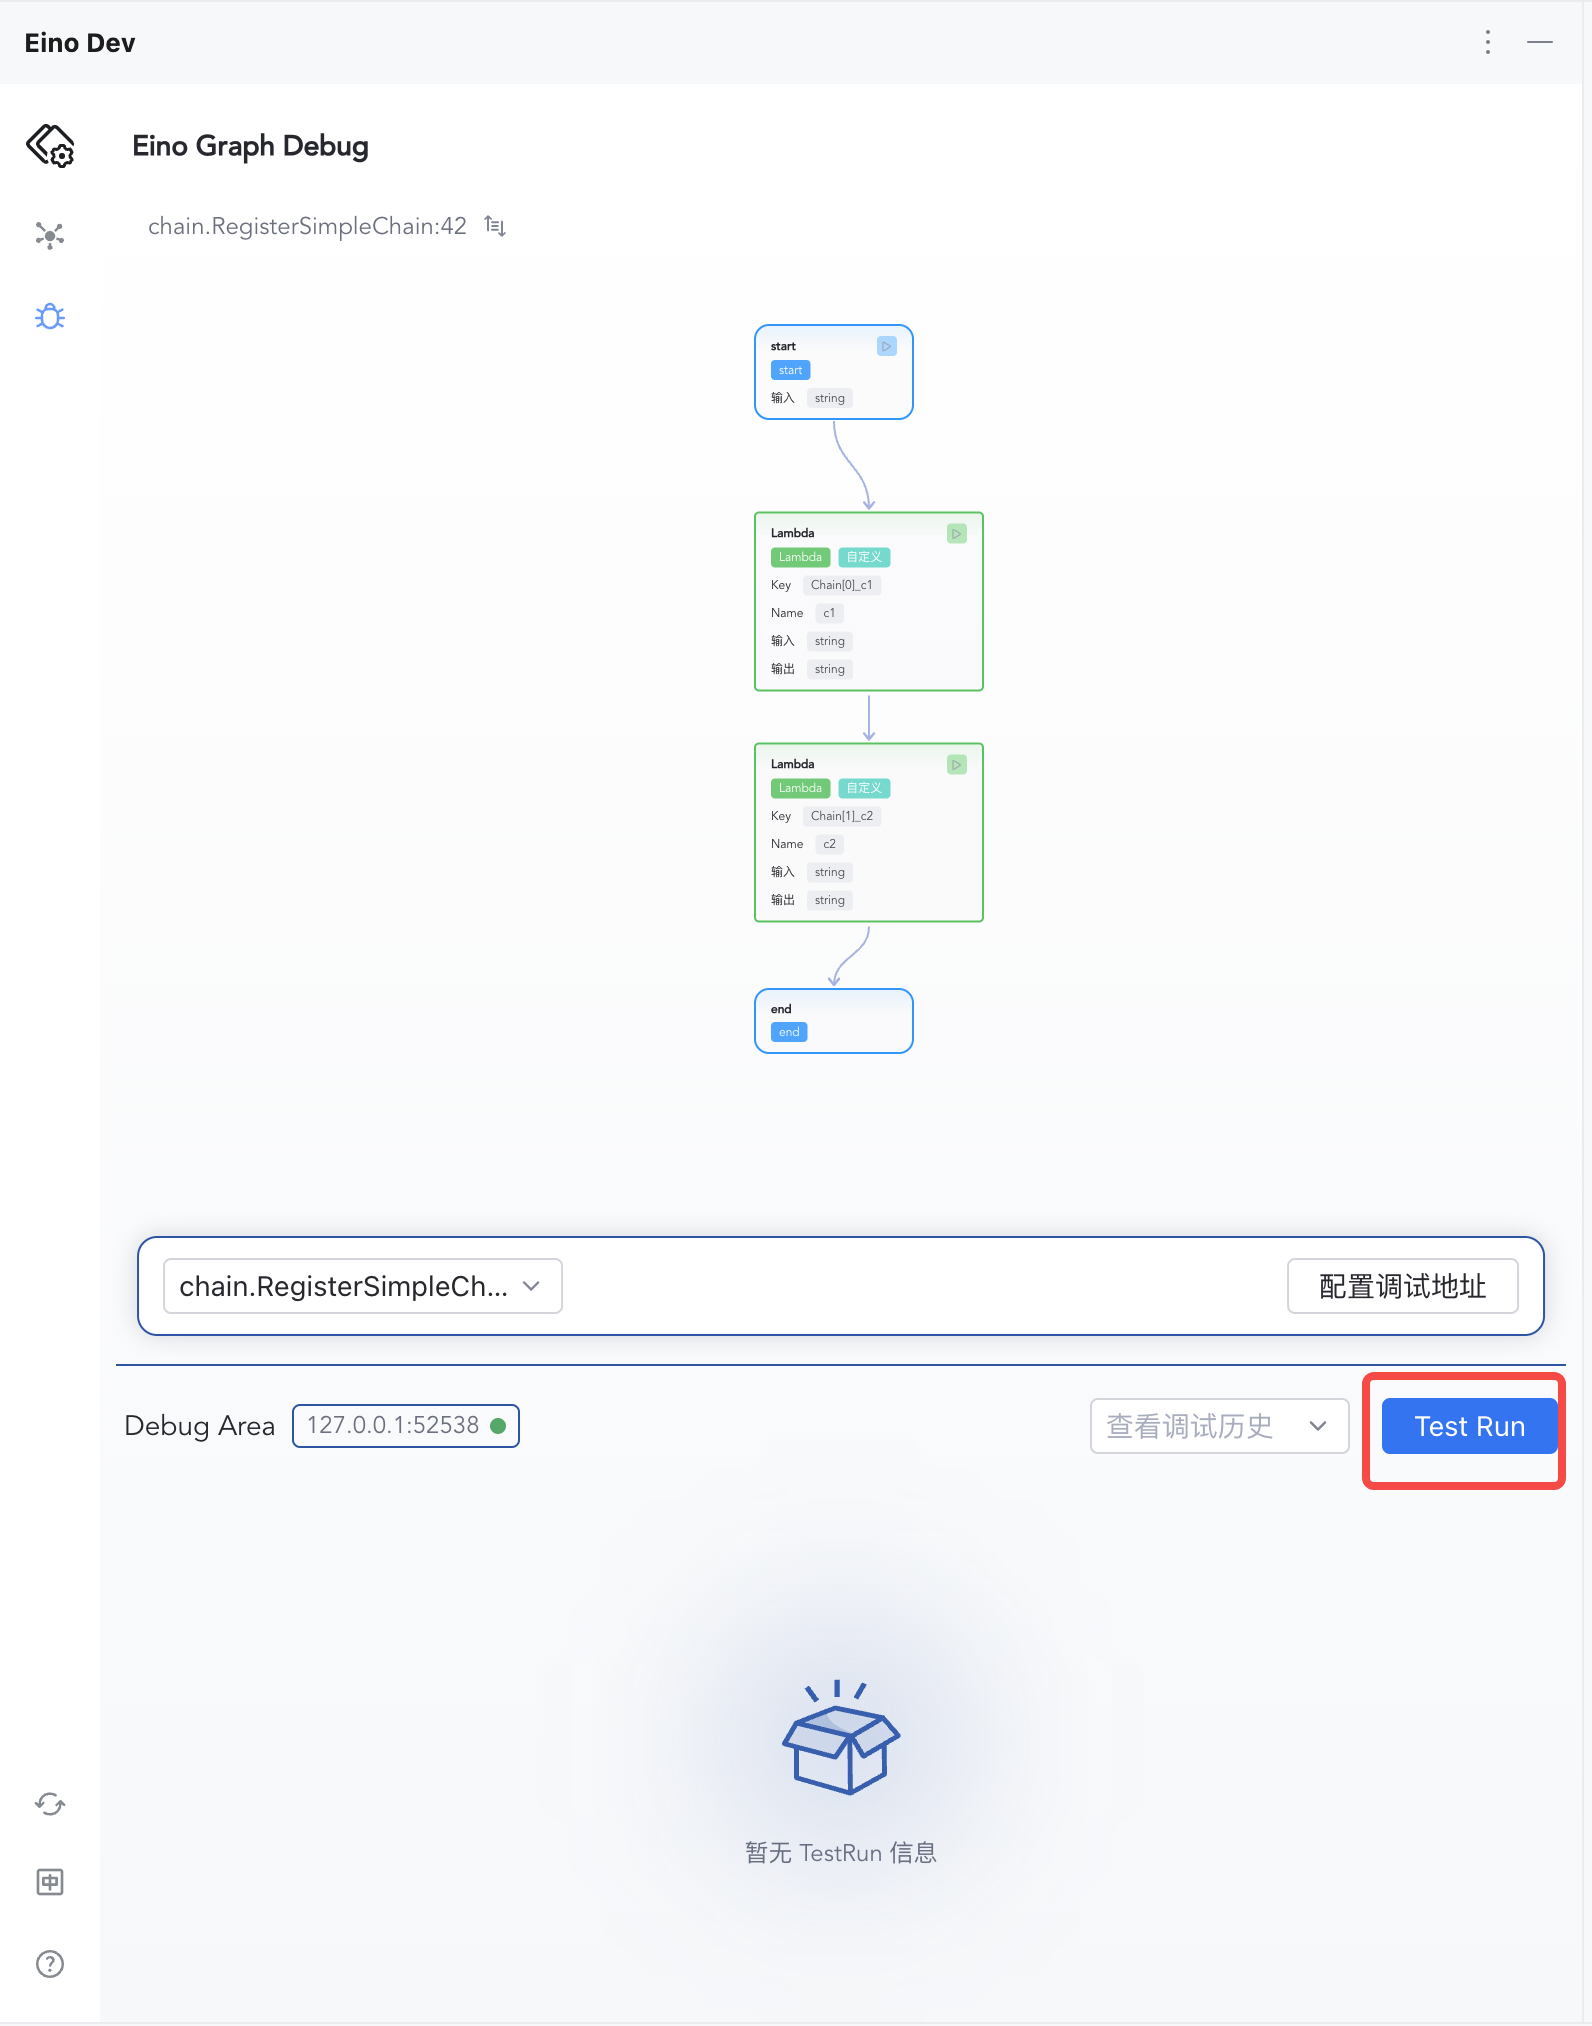
|
2) Enter "hello eino" and confirm
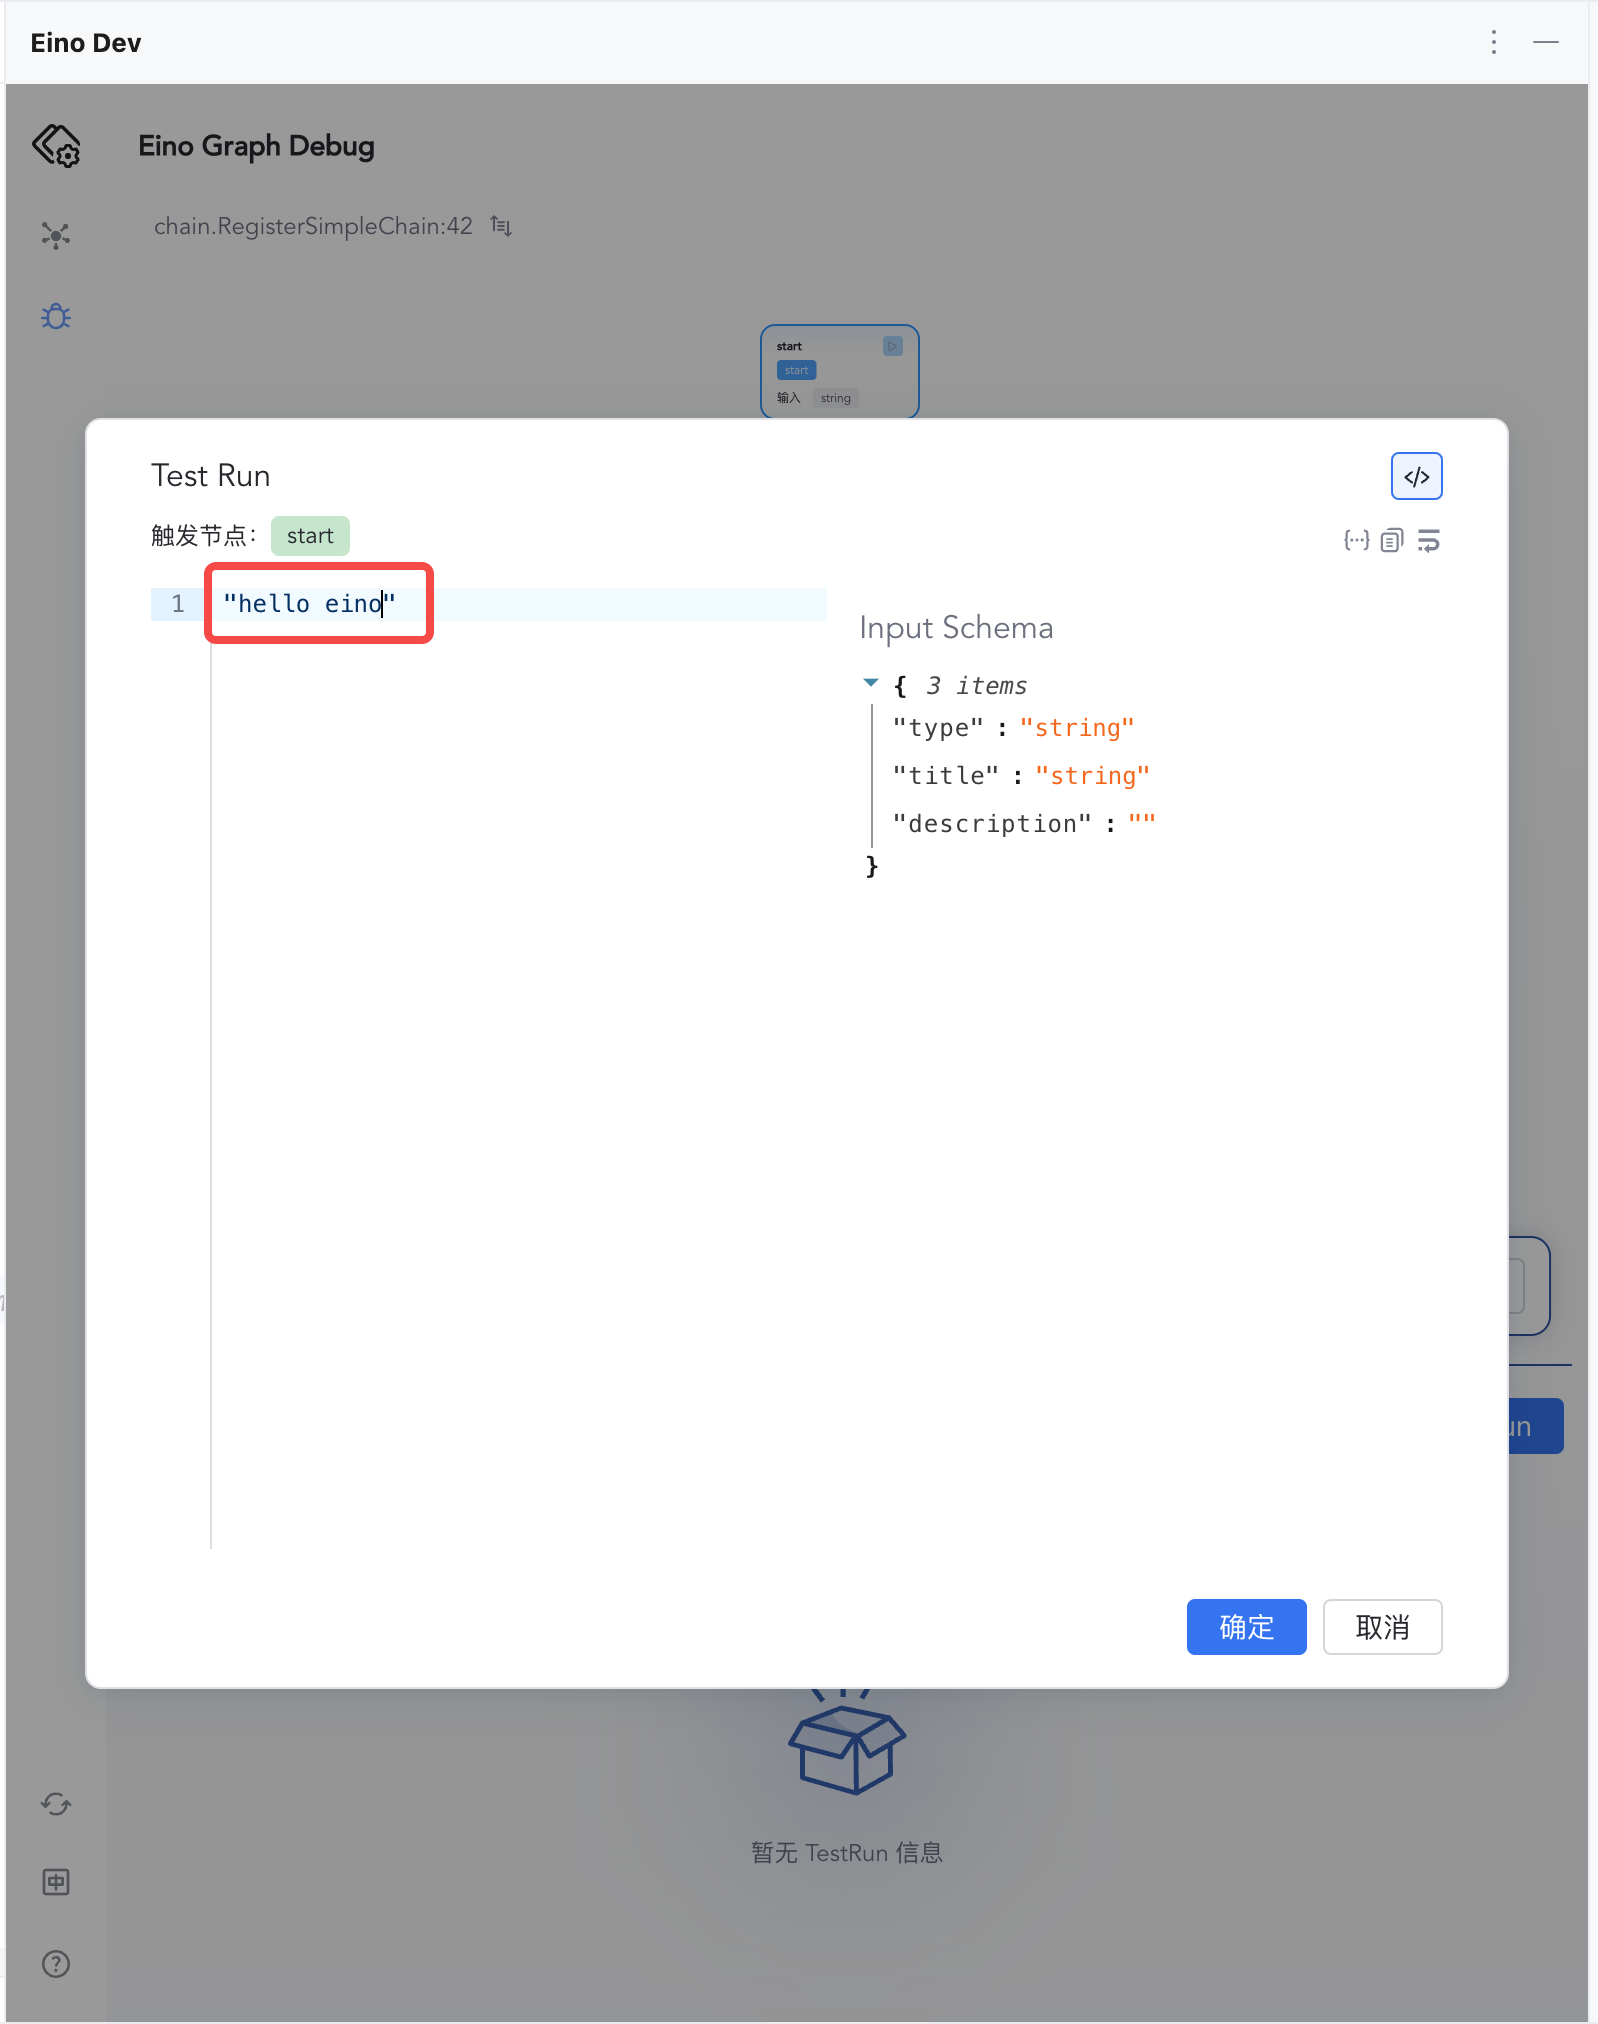
|
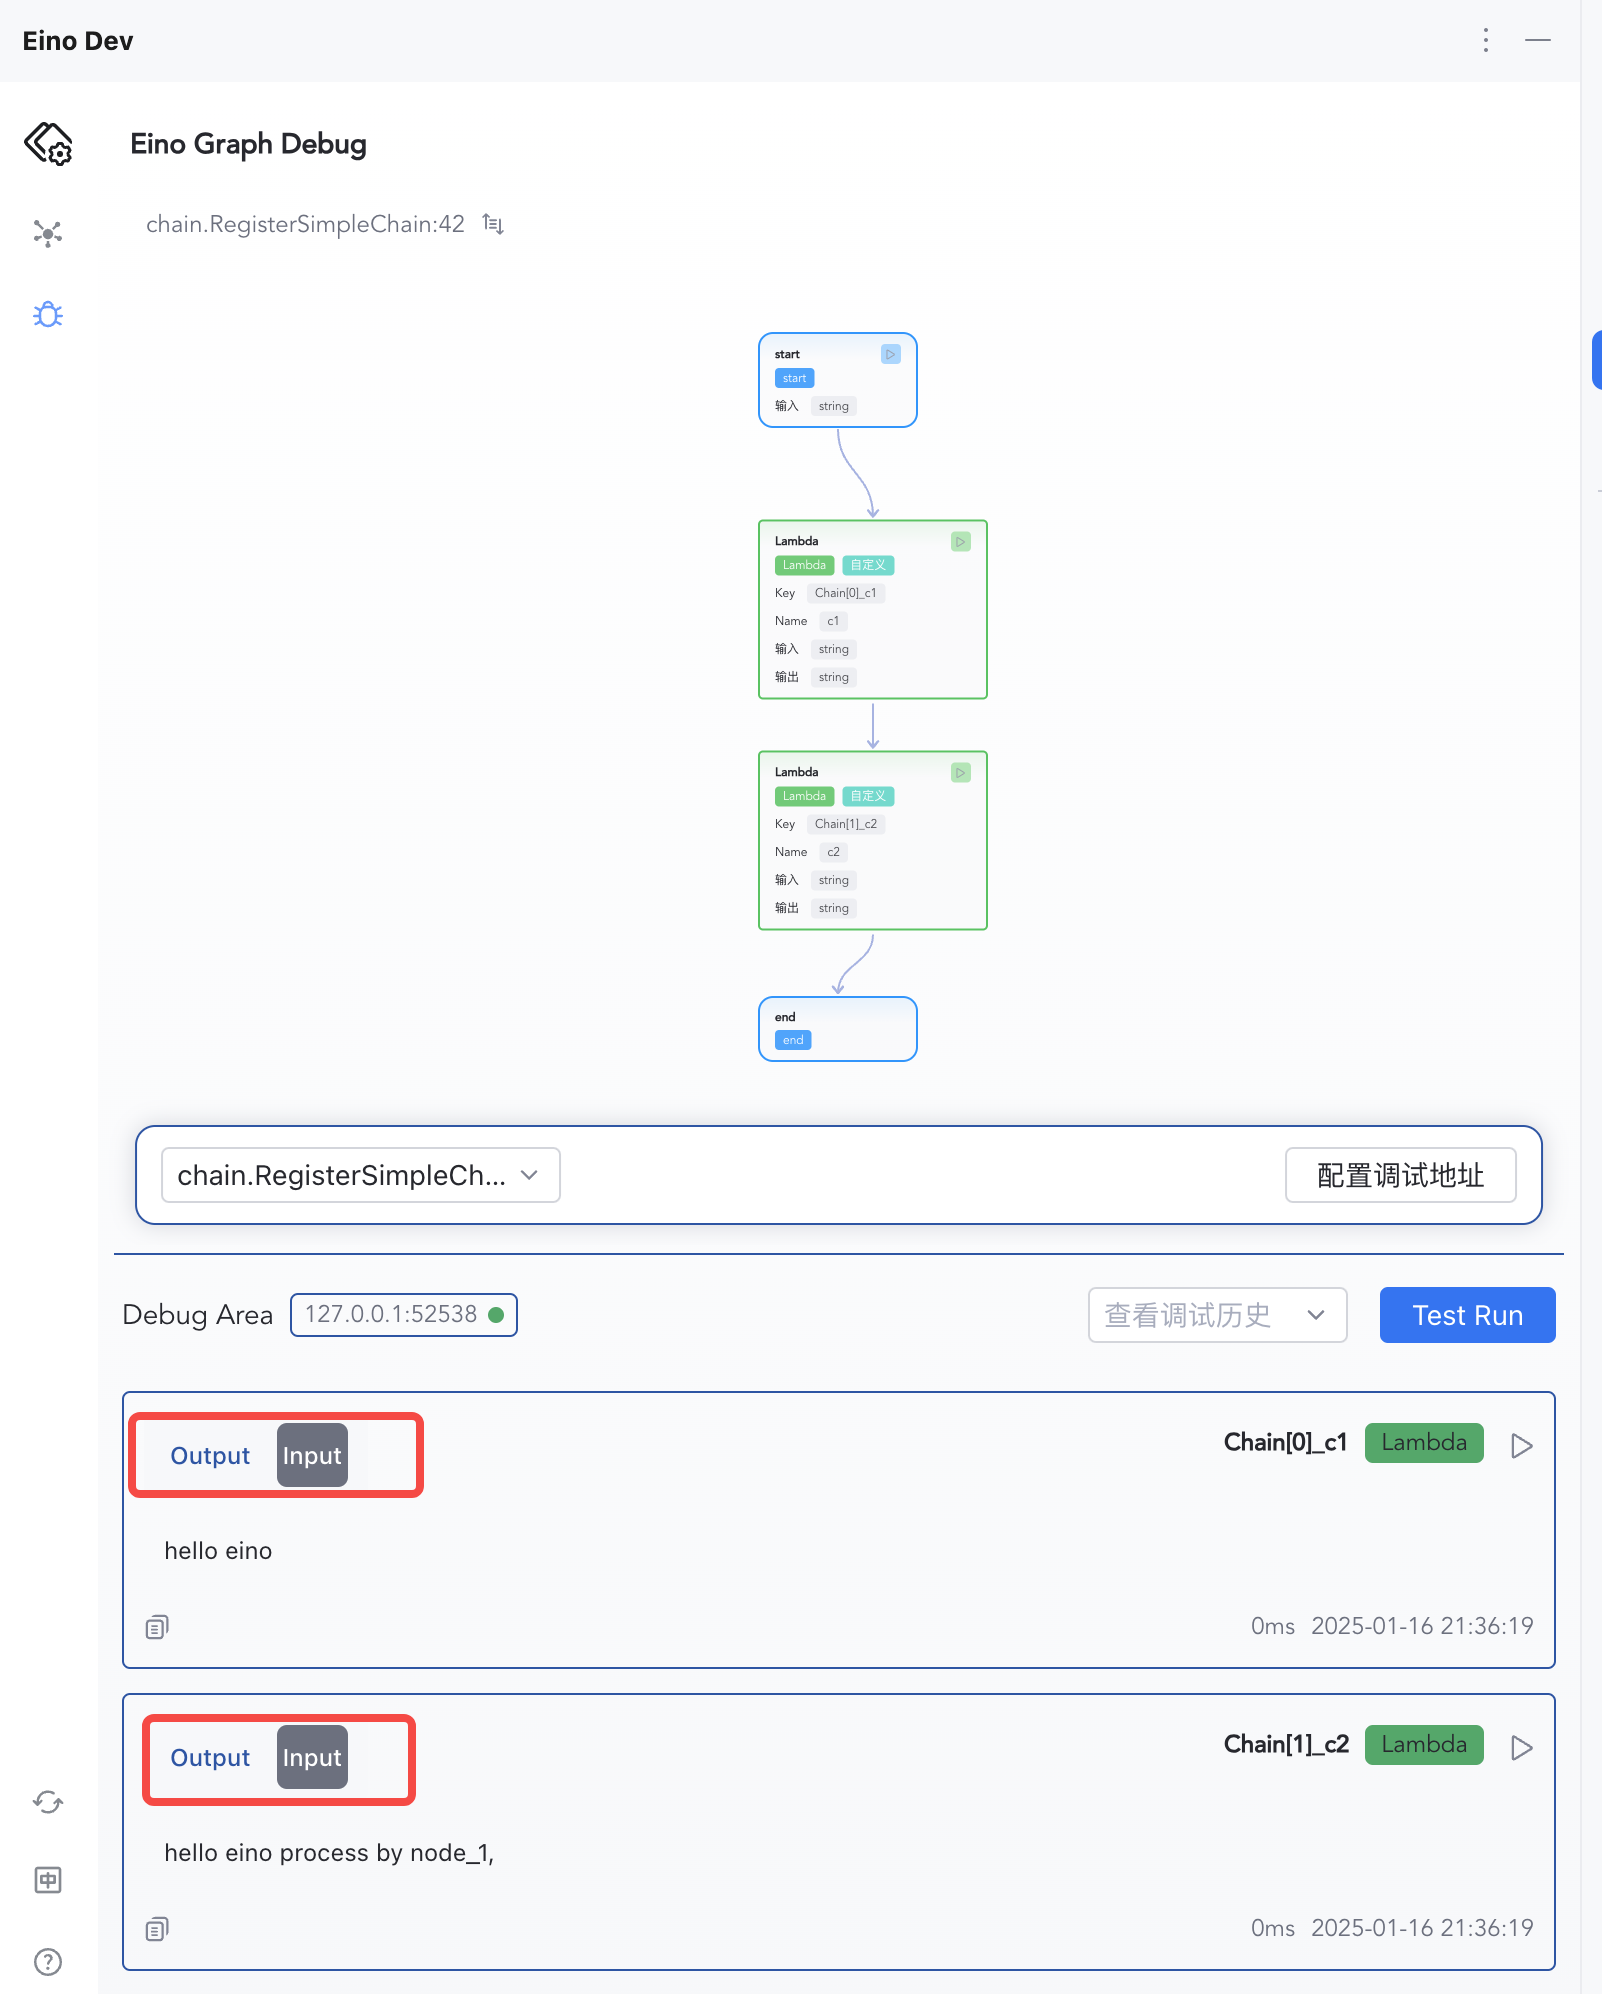
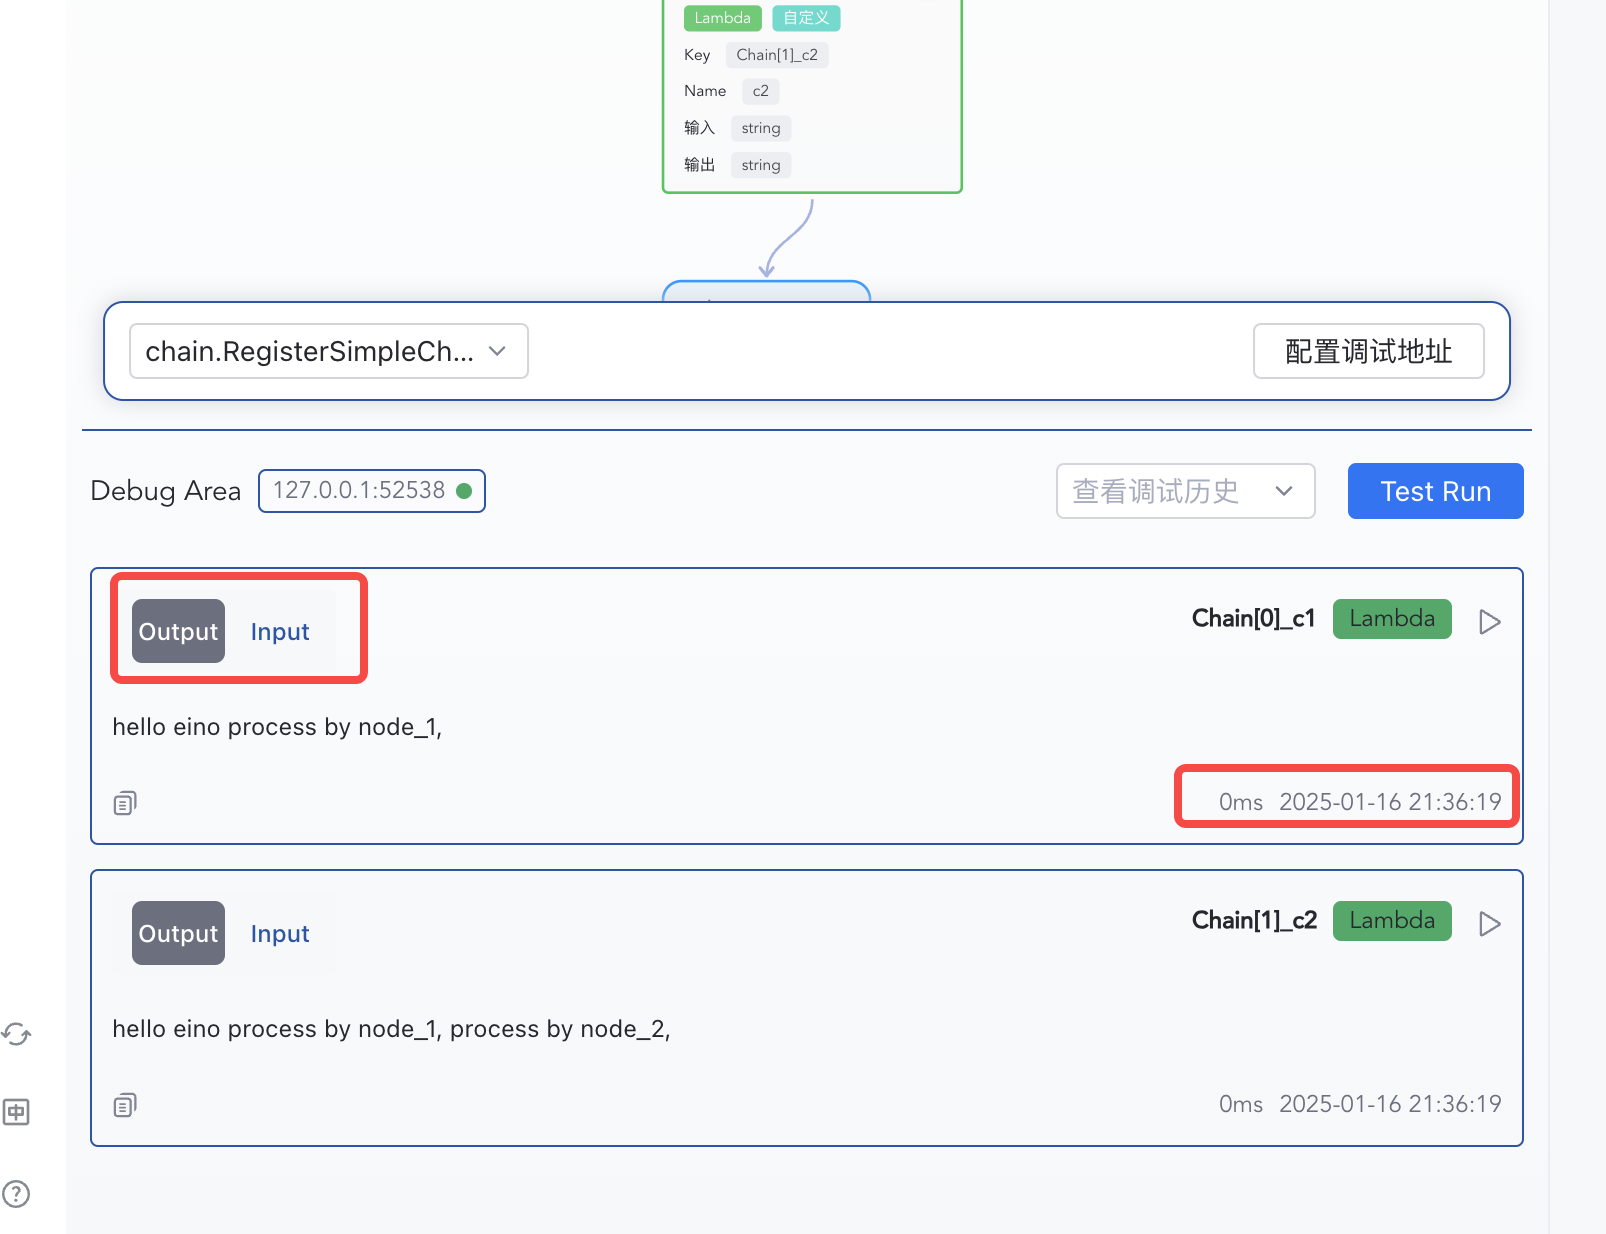
| 3) Inspect per-node inputs/outputs | 4) Switch Input/Output views |
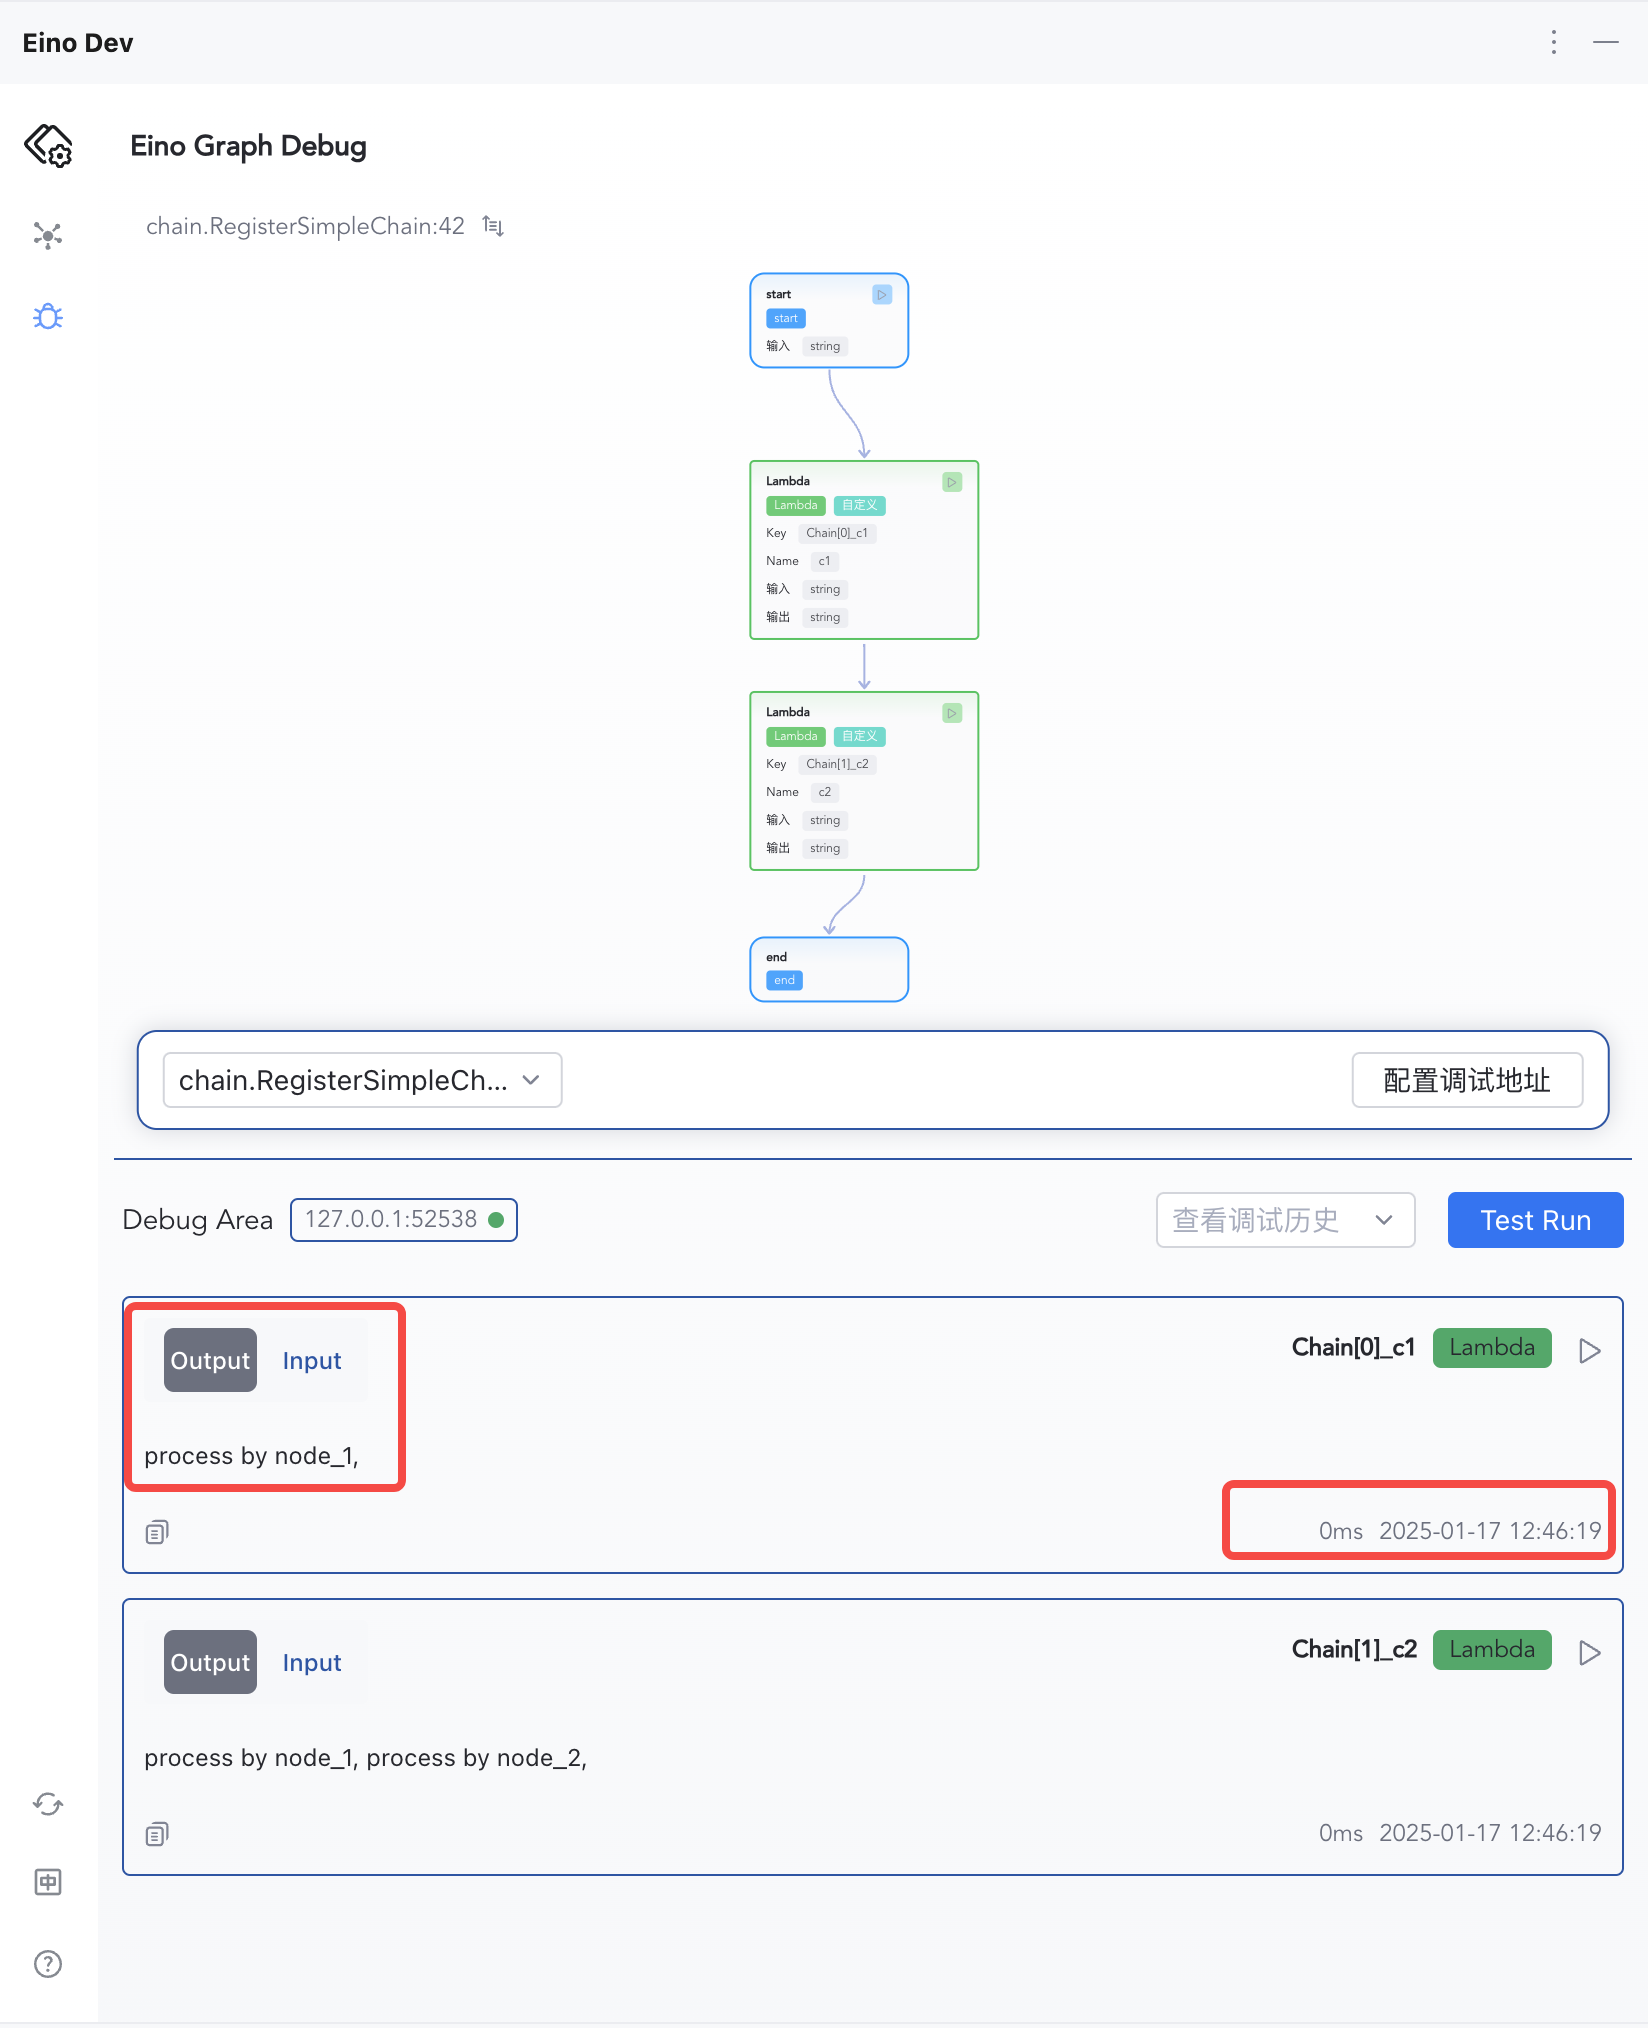 |
 |
Feature Overview
Local or Remote Debugging
Configure IP:Port to connect to the target process, whether local or remote.
Orchestration Visualization
Supports Graph and Chain topology visualization.
Start from Any Node
Inspect Node Results
Each node’s input, output, and execution time are shown in order.
Debugging from Scratch
Orchestrate with Eino
The plugin supports debugging Graph and Chain artifacts. Example registration:
func RegisterSimpleGraph(ctx context.Context) {
    g := compose.NewGraph[string, string]()
    _ = g.AddLambdaNode("node_1", compose.InvokableLambda(func(ctx context.Context, input string) (output string, err error) {
       return input + " process by node_1,", nil
    }))
    _ = g.AddLambdaNode("node_2", compose.InvokableLambda(func(ctx context.Context, input string) (output string, err error) {
       return input + " process by node_2,", nil
    }))
    _ = g.AddLambdaNode("node_3", compose.InvokableLambda(func(ctx context.Context, input string) (output string, err error) {
       return input + " process by node_3,", nil
    }))

    _ = g.AddEdge(compose.START, "node_1")
    _ = g.AddEdge("node_1", "node_2")
    _ = g.AddEdge("node_2", "node_3")
    _ = g.AddEdge("node_3", compose.END)

    _, err := g.Compile(ctx)
    if err != nil {
       logs.Errorf("compile graph failed, err=%v", err)
       return
    }
}
Install Dependencies
go get github.com/cloudwego/eino-ext/devops@latest
go mod tidy
Initialize Debugging
Because debugging starts an HTTP service in your main process to interact with the local plugin, you must call Init() from github.com/cloudwego/eino-ext/devops to start the debug service.
💡 Notes
- Ensure the target orchestration has run
Compile()at least once.devops.Init()must run before callingCompile().- Make sure the main process stays alive after
devops.Init().- Starting from v0.1.9, the debug service default listen address changed from
0.0.0.0to127.0.0.1(local connections only). For remote debugging, explicitly specify the listen IP viaWithDevServerIP, e.g.:devops.Init(ctx, devops.WithDevServerIP("0.0.0.0")).
// 1. Initialize debug service
err := devops.Init(ctx)
if err != nil {
    logs.Errorf("[eino dev] init failed, err=%v", err)
    return
}

// 2. Compile the target orchestration artifact to debug
RegisterSimpleGraph(ctx)
Run Your Process
Run your process locally or remotely, and ensure the main process does not exit.
In github.com/cloudwego/eino-examples/devops/debug/main.go, main() looks like:
func main() {
    ctx := context.Background()
    // Init eino devops server
    err := devops.Init(ctx)
    if err != nil {
       logs.Errorf("[eino dev] init failed, err=%v", err)
       return
    }

    // Register chain, graph and state_graph for demo use
    chain.RegisterSimpleChain(ctx)
    graph.RegisterSimpleGraph(ctx)
    graph.RegisterSimpleStateGraph(ctx)

    // Blocking process exits
    sigs := make(chan os.Signal, 1)
    signal.Notify(sigs, syscall.SIGINT, syscall.SIGTERM)
    <-sigs

    // Exit
    logs.Infof("[eino dev] shutting down\n")
}
Configure Address
- IP: IP address of the server where the user process is running.
- If the user process is running on local computer, enter
127.0.0.1; - If the user process is running on a remote server, enter the remote server’s IP address, supporting both IPv4 and IPv6.
- If the user process is running on local computer, enter
- Port: Port the debug service listens on, default is
52538, configurable via theWithDevServerPortoption method.
💡 Notes
- Local debugging: The system may pop up a network access warning; allow access.
- Remote debugging: Ensure the port is accessible. Additionally, starting from v0.1.9, the default listen address is
127.0.0.1only; for remote debugging you must specify an accessible IP (e.g.,0.0.0.0) viaWithDevServerIPwhen callingdevops.Init().
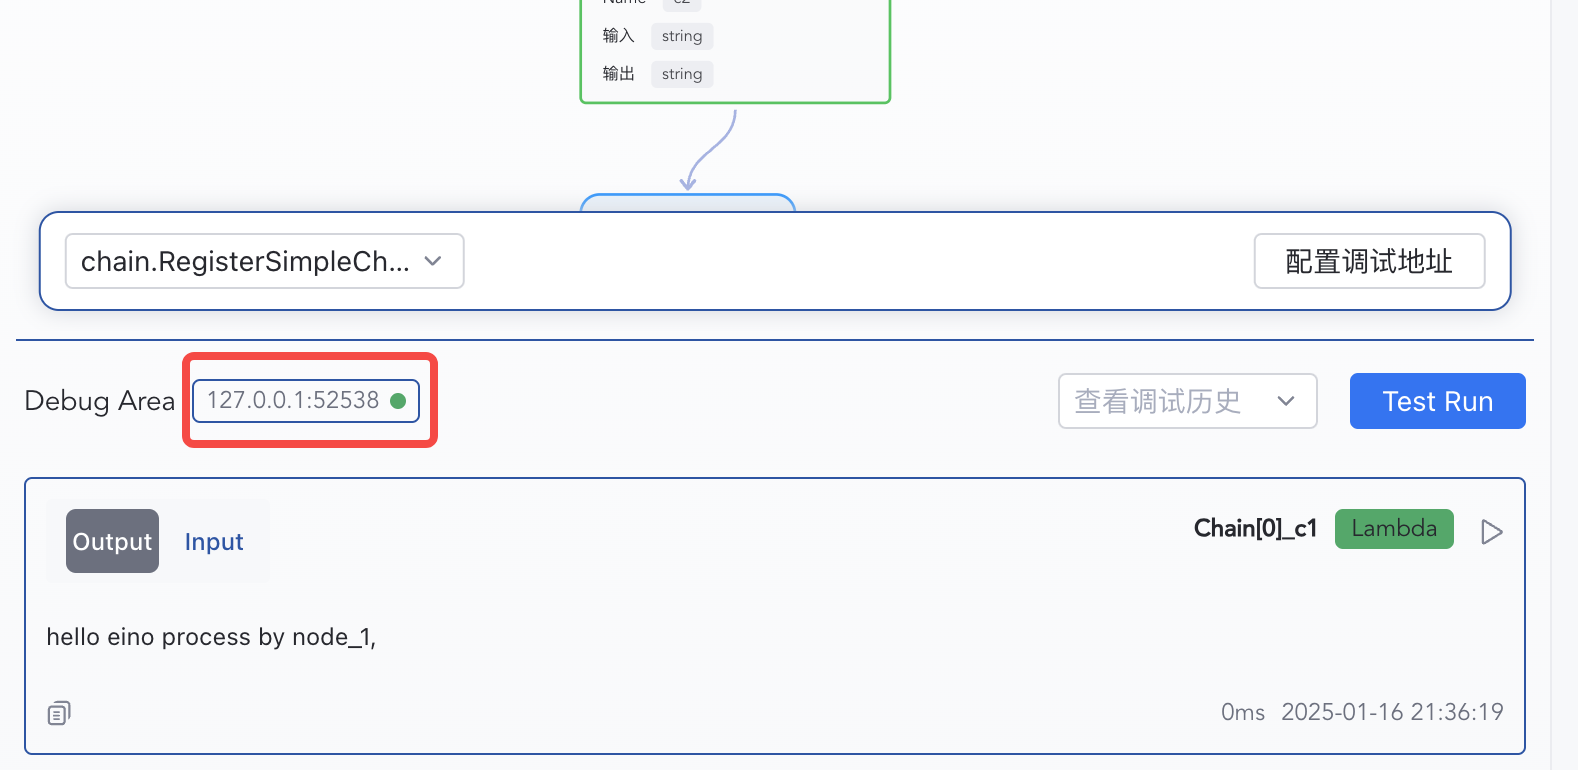
Once IP and Port are configured, click confirm. The debug plugin will automatically connect to the target debug server. If successfully connected, the connection status indicator will turn green.
Select an Artifact
Ensure your target orchestration has been compiled at least once. Multiple Compile() runs register multiple artifacts; you’ll see them in the selection list.
Start Debugging
- From START: click “Test Run”, enter mock input (complex types are inferred), and confirm.
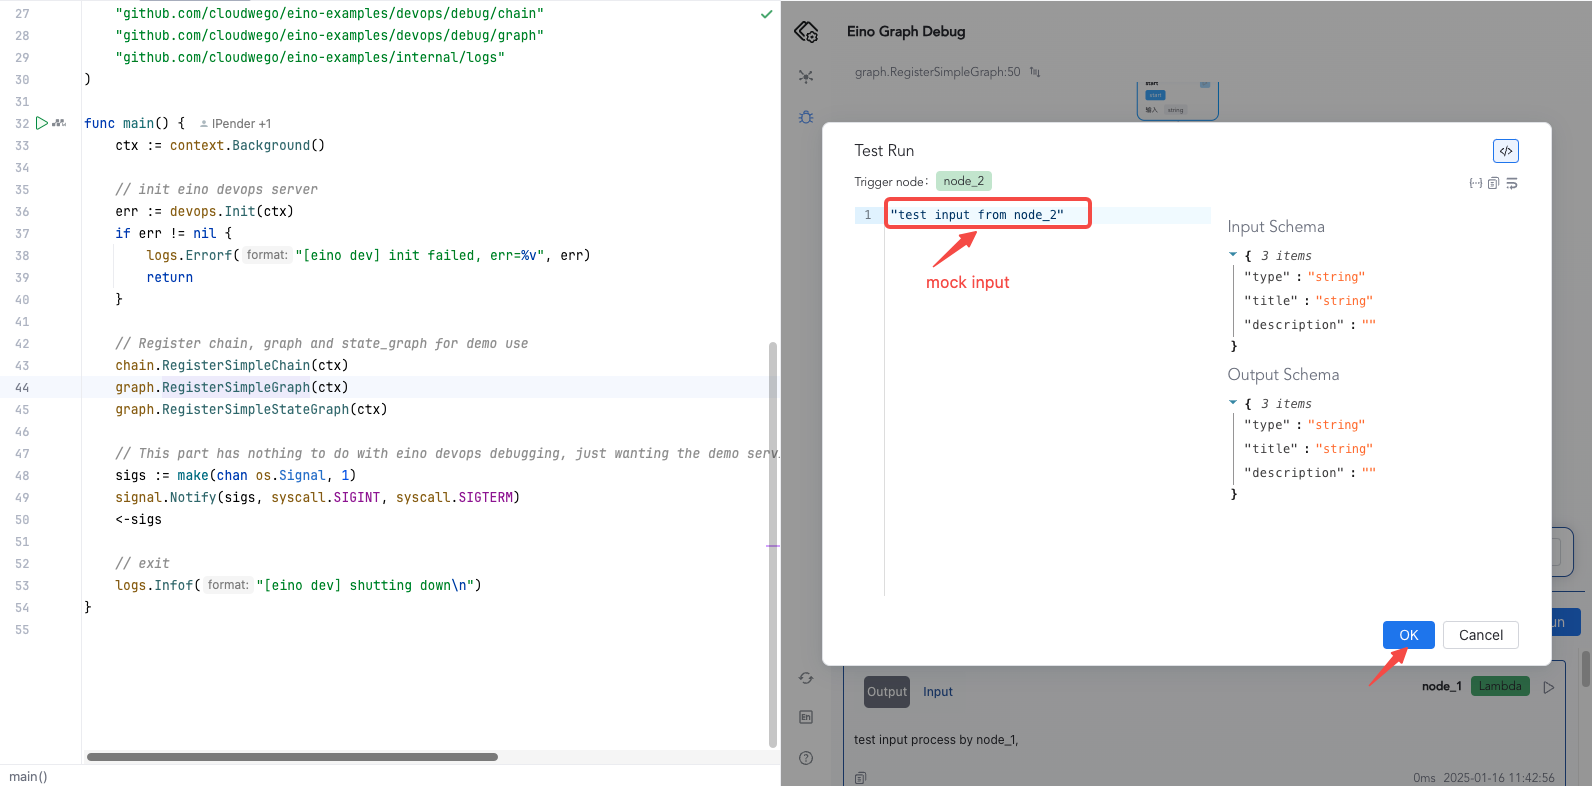
- From a specific node: click the run button on that node to start debugging from there.
View Execution Results
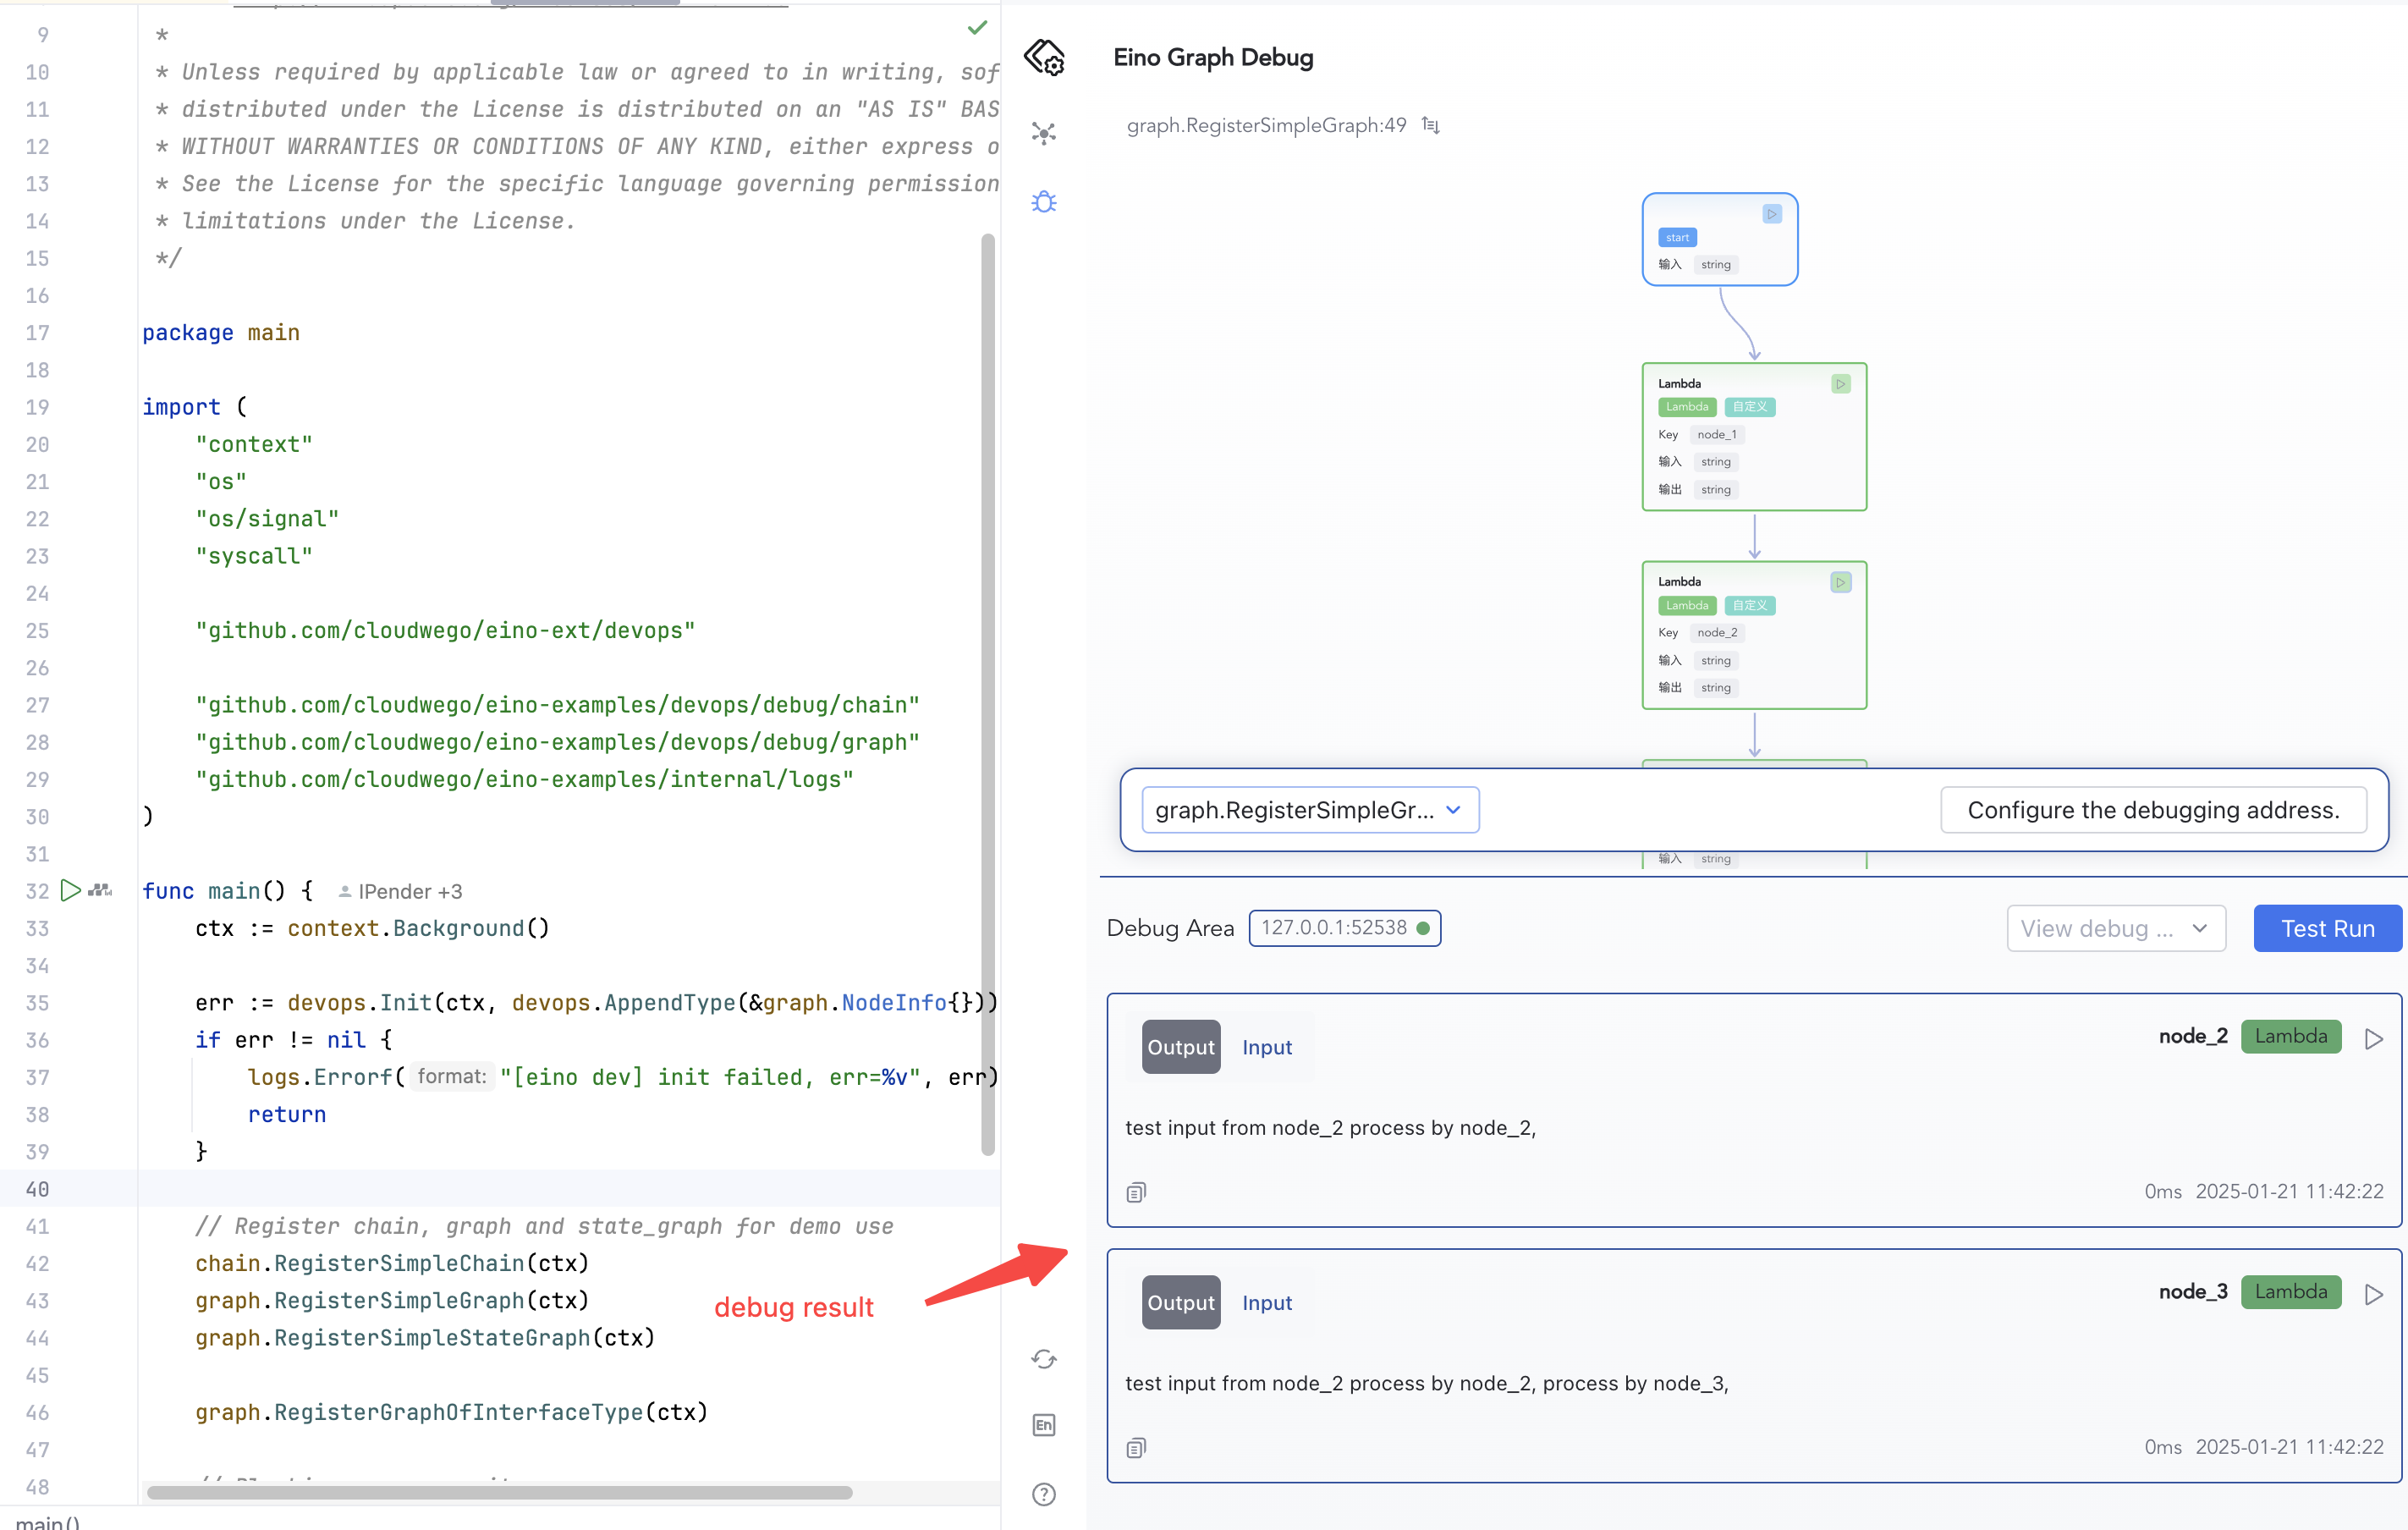
Debugging from the START node: after clicking Test Run, view debug results in the plugin panel below.
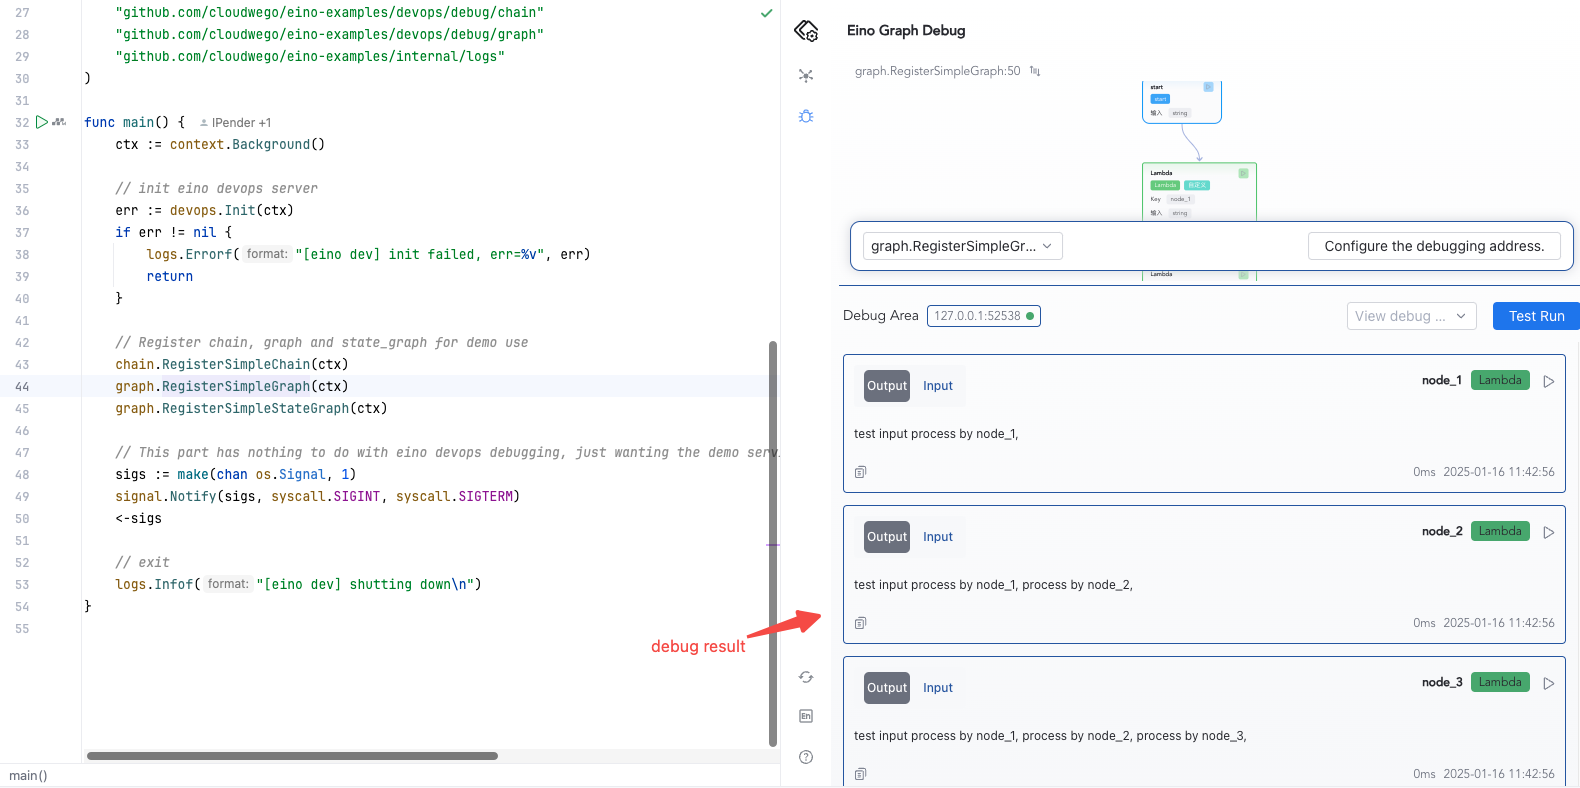
Debugging from any operable node: view debug results in the plugin panel below.
Advanced
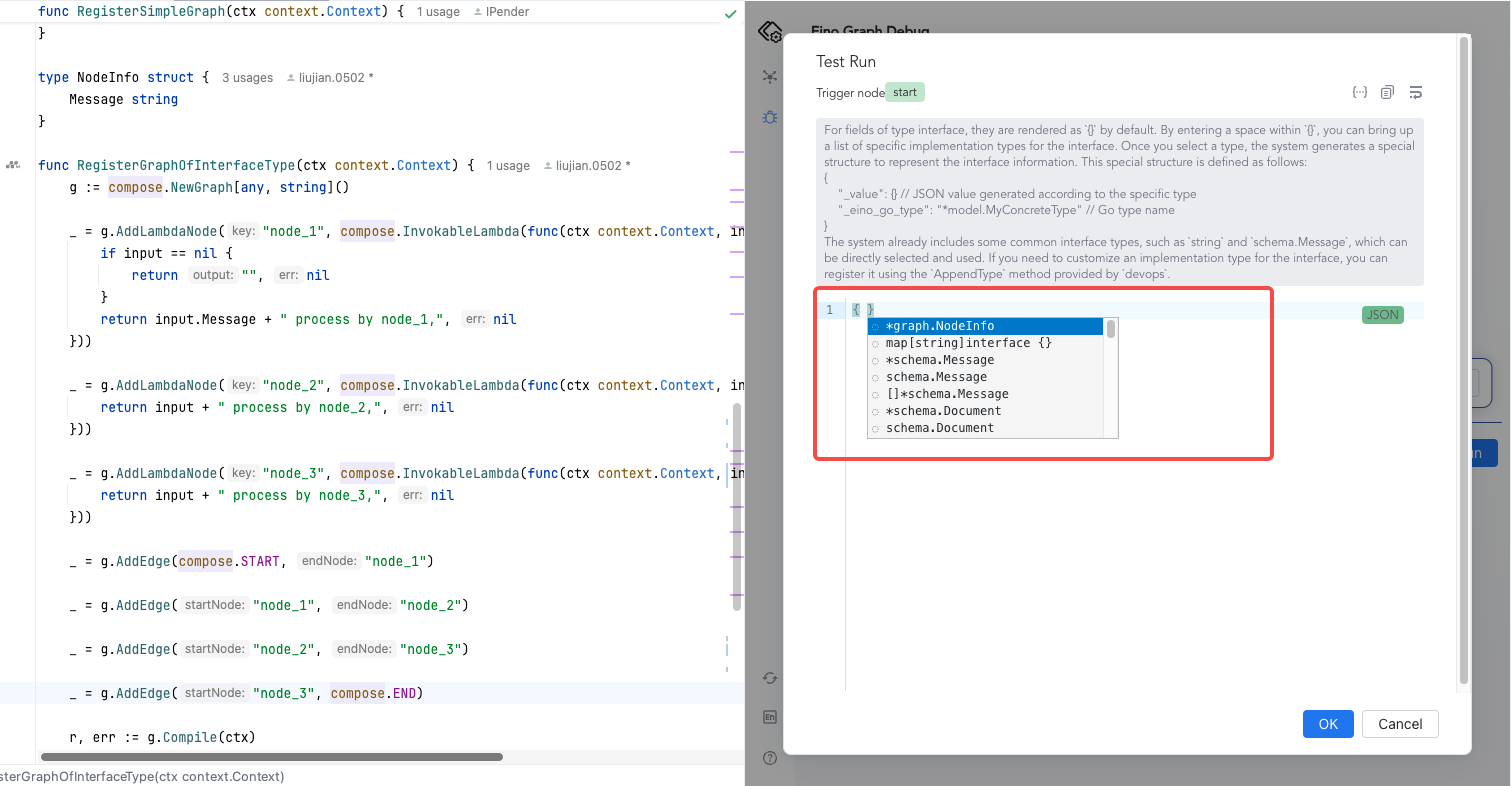
Specify Implementation Type for Interface Fields
Interface-typed fields render as {} by default. Type a space inside {} to select an implementation type. The plugin uses a special JSON structure:
{
  "_value": {},           // JSON value of the concrete type
  "_eino_go_type": "*model.MyConcreteType" // Go type name
}
💡 Common interface types like
string,schema.Messageare built-in. To register custom types, usedevops.AppendTypeduringInit().
- Suppose you have orchestration code where the graph input is
any, andnode_1takes*NodeInfo:
type NodeInfo struct {
    Message string
}

func RegisterGraphOfInterfaceType(ctx context.Context) {
    // Define a graph that input parameter is any.
    g := compose.NewGraph[any, string]()

    _ = g.AddLambdaNode("node_1", compose.InvokableLambda(func(ctx context.Context, input *NodeInfo) (output string, err error) {
       if input == nil {
          return "", nil
       }
       return input.Message + " process by node_1,", nil
    }))

    _ = g.AddLambdaNode("node_2", compose.InvokableLambda(func(ctx context.Context, input string) (output string, err error) {
       return input + " process by node_2,", nil
    }))

    _ = g.AddLambdaNode("node_3", compose.InvokableLambda(func(ctx context.Context, input string) (output string, err error) {
       return input + " process by node_3,", nil
    }))

    _ = g.AddEdge(compose._START_, "node_1")

    _ = g.AddEdge("node_1", "node_2")

    _ = g.AddEdge("node_2", "node_3")

    _ = g.AddEdge("node_3", compose._END_)

    r, err := g.Compile(ctx)
    if err != nil {
       logs.Errorf("compile graph failed, err=%v", err)
       return
    }
}
- Before debugging, register the custom
*NodeInfotype withAppendTypeatInit():
err := devops.Init(ctx, devops.AppendType(&graph.NodeInfo{}))
- During Test Run, interface fields show
{}by default. Type a space inside{}to view all built-in and custom types, and select the concrete implementation type for that interface.
- Fill in the debug node input in the
_valuefield.
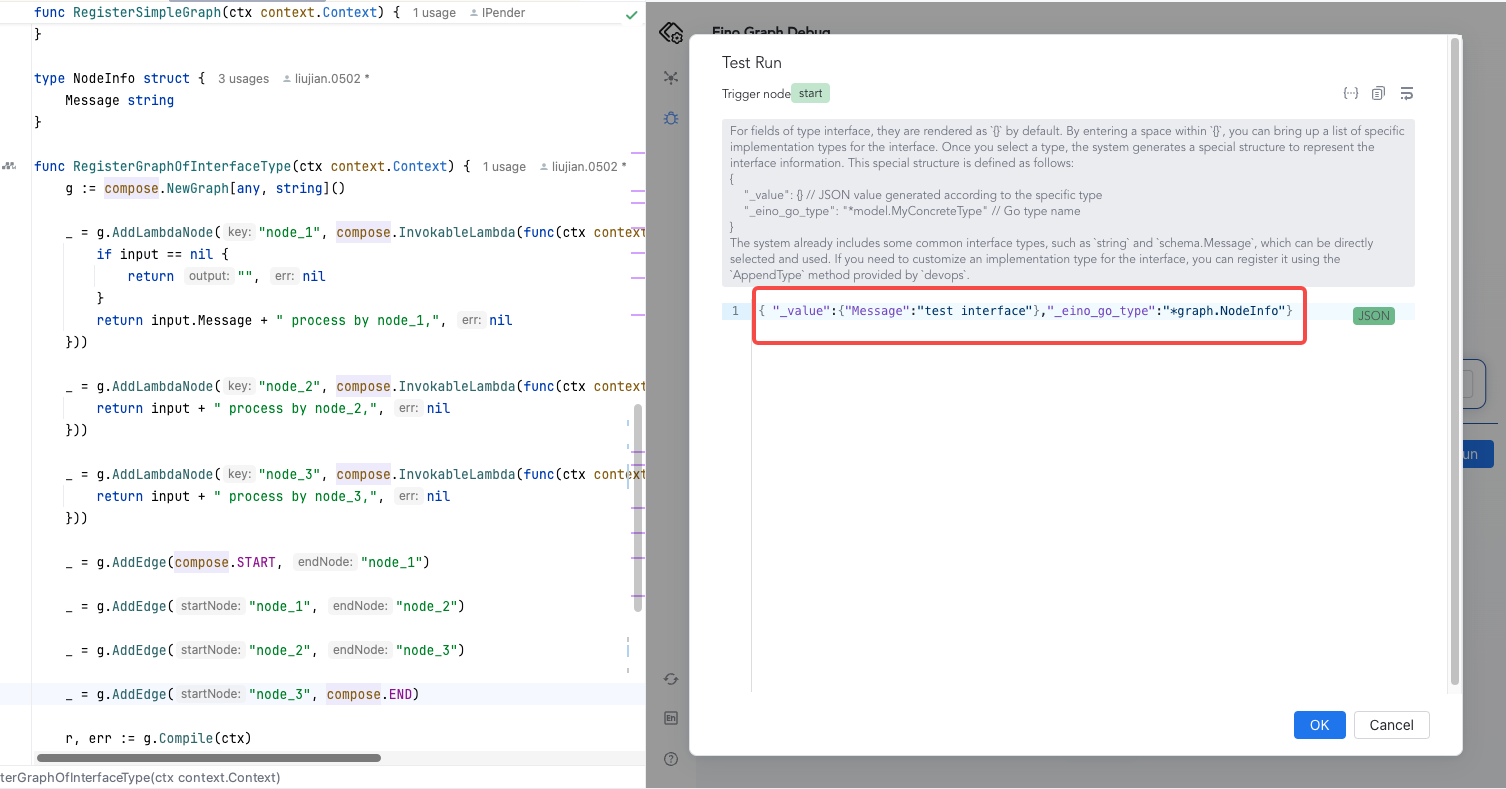
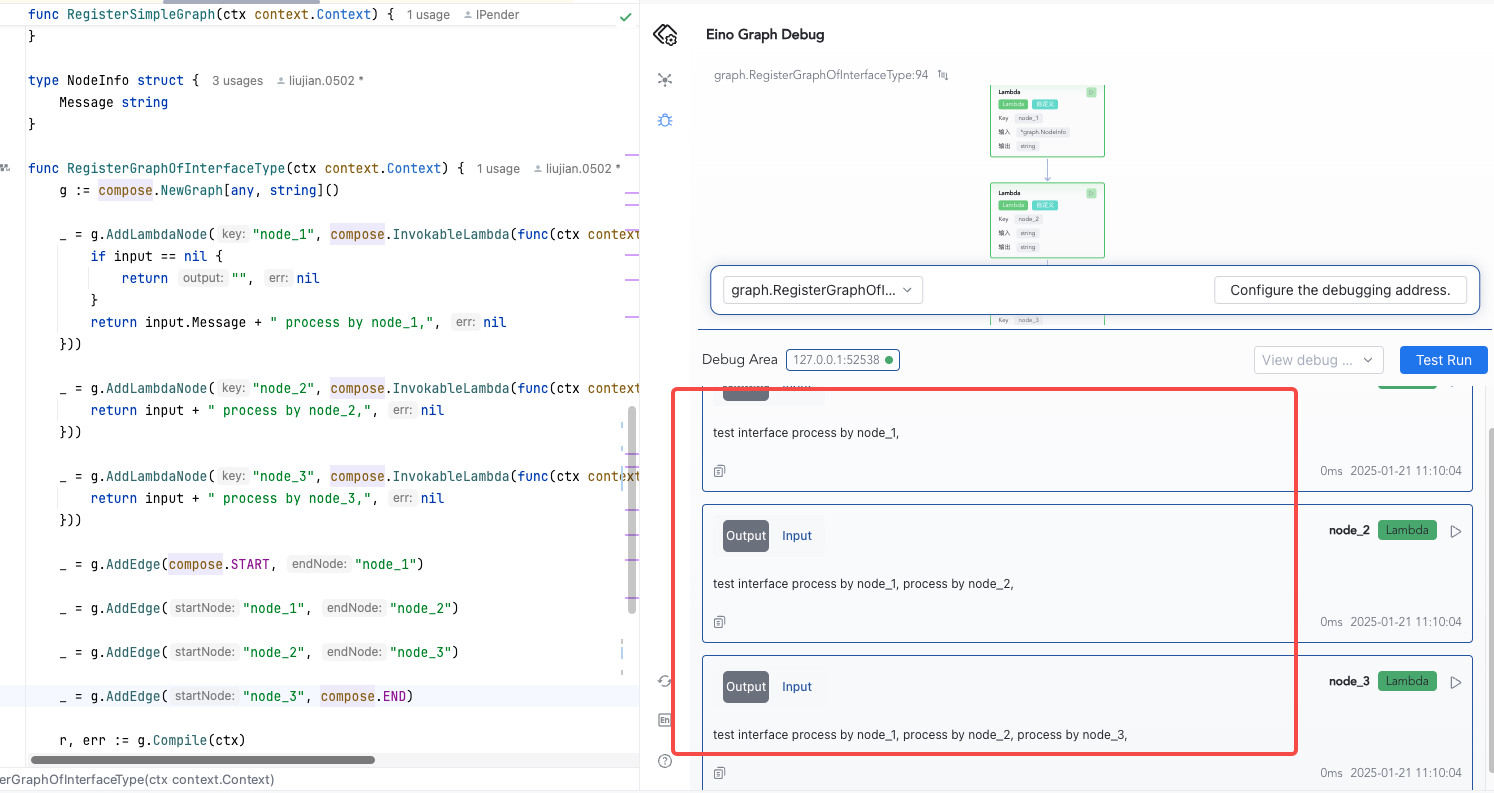
- Click confirm to view the debug results.
Debugging map[string]any
Here we explain how to debug when the input type is map[string]any. If a node’s input type is map[string]any, as shown below:
func RegisterAnyInputGraph(ctx context.Context) {
        g := compose.NewGraph[map[string]any, string]()

        _ = g.AddLambdaNode("node_1", compose.InvokableLambda(func(ctx context.Context, input map[string]any) (output string, err error) {
                for k, v := range input {
                        switch v.(type) {
                        case string:
                                output += k + ":" + v.(string) + ","
                        case int:
                                output += k + ":" + fmt.Sprintf("%d", v.(int))
                        default:
                                return "", fmt.Errorf("unsupported type: %T", v)
                        }
                }

                return output, nil
        }))

        _ = g.AddLambdaNode("node_2", compose.InvokableLambda(func(ctx context.Context, input string) (output string, err error) {
                return input + " process by node_2,", nil
        }))

        _ = g.AddEdge(compose.START, "node_1")

        _ = g.AddEdge("node_1", "node_2")

        _ = g.AddEdge("node_2", compose.END)

        r, err := g.Compile(ctx)
        if err != nil {
                logs.Errorf("compile graph failed, err=%v", err)
                return
        }

        message, err := r.Invoke(ctx, map[string]any{"name": "bob", "score": 100})
        if err != nil {
                logs.Errorf("invoke graph failed, err=%v", err)
                return
        }

        logs.Infof("eino any input graph output is: %v", message)
}
During debugging, in the Test Run JSON input box, you need to enter content in the following format:
{
  "name": {
    "_value": "alice",
    "_eino_go_type": "string"
  },
  "score": {
    "_value": "99",
    "_eino_go_type": "int"
  }
}